Part of running Kubernetes is being able to monitoring the cluster, the nodes, and the workloads running in it. Running production workloads regardless of PaaS, VM’s, or containers requires a solid level of reliability. Azure Kubernetes Service comes with monitoring provided from Azure bundled with the semi-managed service. Kubernetes also has built in monitoring that can also be utilized.
It is important to note that AKS is a free service and Microsoft aims to achieve at least 99.5% availability for the Kubernetes API server on the master node side.
But due to AKS being a free service Microsoft does not carry an SLA on the Kubernetes cluster service itself. Microsoft does provide an SLA for the availability of the underlying nodes in the cluster via the Azure Virtual Machines SLA. Without an official SLA for the Kubernetes cluster service it becomes even more critical to understand your deployment and have the right monitoring tooling and plan in place so when an issue arises the DevOps or CloudOps team can address, investigate, and resolve any issues with the cluster.
The monitoring service included with AKS gives you monitoring from two perspectives including the first one being directly from an AKS cluster and the second one being all AKS clusters in a subscription. The monitoring looks at two key areas “Health status” and “Performance charts” and consists of:
Insights – Monitoring for the Kubernetes cluster and containers.
Metrics – Metric based cluster and pod charts.
Log Analytics – K8s and Container logs viewing and search.
Azure Monitor
Azure Monitor has a containers section. Here is where you will find a health summary across all clusters in a subscription including ACS. You also will see how many nodes and system/user pods a cluster has and if there are any health issues with the a node or pod. If you click on a cluster from here it will bring you to the Insights section on the AKS cluster itself.

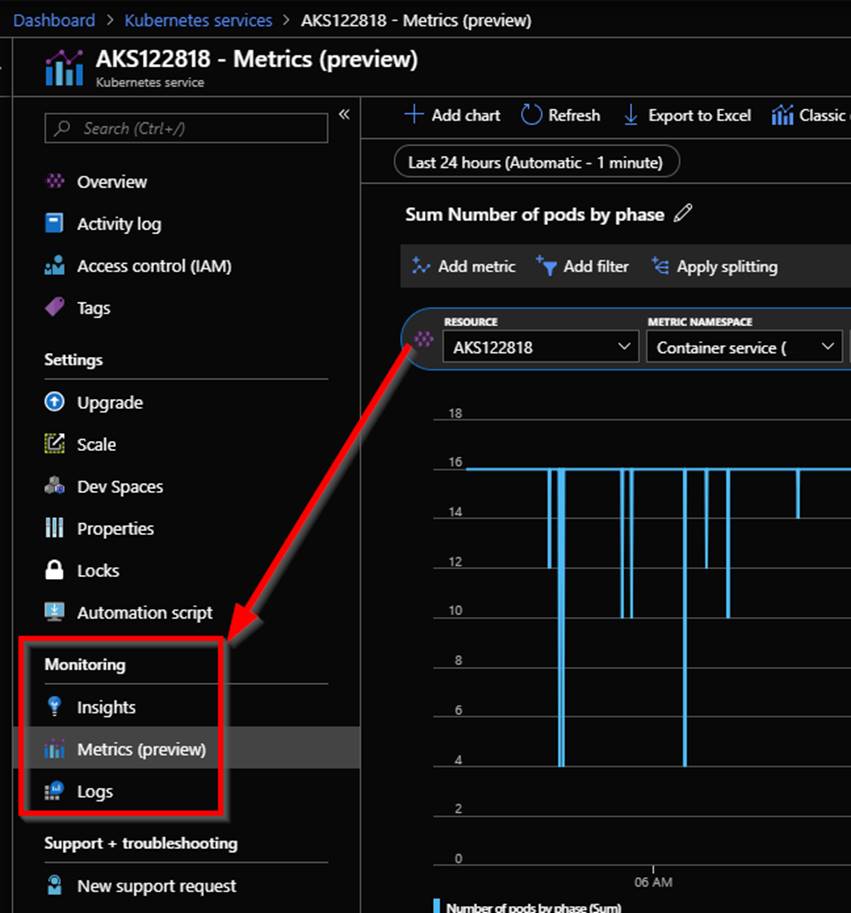
If you click on an AKS cluster you will be brought to the Insights section of AKS monitoring on the actual AKS cluster. From here you can access the Metrics section and the Logs section as well as shown in the following screenshot.
Insights
Insights is where you will find the bulk of useful data when it comes to monitoring AKS. Within Insights you have these 4 areas Cluster, Nodes, Controllers, and Containers. Let’s take a deeper look into each of the 4 areas.
Cluster
The cluster page contains charts with key performance metrics for your AKS clusters health. It has performance charts for your node count with status, pod count with status, along with aggregated node memory and CPU utilization across the cluster. In here you can change the date range and add filters to scope down to specific information you want to see.

Nodes
After clicking on the nodes tab you will see the nodes running in your AKS cluster along with uptime, amount of pods on the node, CPU usage, memory working set, and memory RSS. You can click on the arrow next to a node to expand it displaying the pods that are running on it.

What you will notice is that when you click on a node, or pod a property pane will be shown on the right hand side with the properties of the selected object. An example of a node is shown in the following screenshot.

Controllers
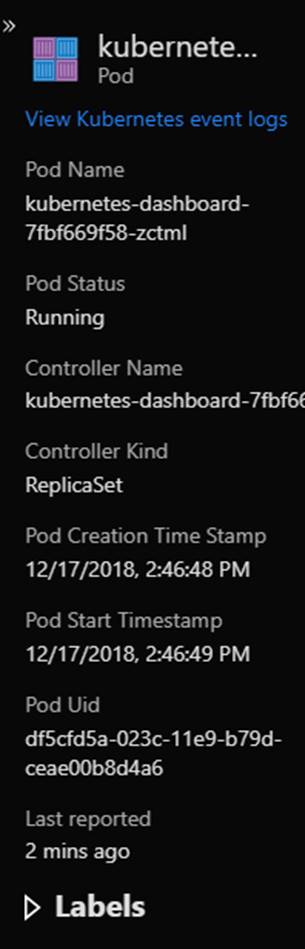
Click on the Controllers tab to see the health of the clusters controllers. Again here you will see CPU usage, memory working set, and memory RSS of each controller and what is running a controller. As an example shown in the following screenshot you can see the kubernetes dashboard pod running on the kubernetes-dashboard controller.

The properties of the kubernetes dashboard pod as shown in the following screenshot gives you information like the pod name, pod status, Uid, label and more.
You can drill in to see the container the pod was deployed using.
Containers
On the Containers tab is where all the containers in the AKS cluster are displayed. An as with the other tabs you can see CPU usage, memory working set, and memory RSS. You also will see status, the pod it is part of, the node its running on, its uptime and if it has had any restarts. In the following screenshot the CPU usage metric filter is used and I am showing a containers that has restarted 71 times indicating an issue with that container.

In the following screenshot the memory working set metric filter is shown.

You can also filter the containers that will be shown through using the searching by name filter.

You also can see a containers logs in the containers tab. To do this select a container to show its properties. Within the properties you can click on View container live logs (preview) as shown in the following screenshot or View container logs. Container log data is collected every three minutes. STDOUT and STDERR is the log output from each Docker container that is sent to Log Analytics.
Kube-system is not currently collected and sent to Log Analytics. If you are not familiar with Docker logs more information on STDOUT and STDERR can be found on this Docker logging article here: https://docs.docker.com/config/containers/logging.

Clicking on View container logs will bring you to the Log Analytics log search page with that containers logs shown in the results pain.

Metrics
In the metrics section you can see metric based cluster and pod charts that can help you see information that is important to you about your AKS. Note that this service is still in preview so more functionally and metrics will be added to it later. Here is a screenshot with a couple of example charts showing pods by phase split based on namespace and total of available cores in a cluster.

Currently the only available metric namespace is microsoft.containerservice/managedclusters, aggregation can only be Sum as of now and the metrics you can see are:

Within the metrics section you can pin charts to your Azure dashboard and you can create an alert based on a condition such as when pods are in a failed state.
Log Analytics
Log Analytics is used across many Azure services for viewing logs and searches to analyze and find specific data to identify trends, patterns, issues and more. In this section you can gain deep insights into your AKS cluster and containers. Here is the log schema collected in Container Insights:
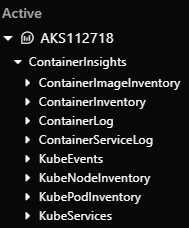
The data types in the ContainerInsights schema are what appear in the Log Analytics search results. When you click on Logs from within the AKS cluster you will see the Log Analytics search page as shown in the following screenshot:

You can use the Filter to filter down the results of a search. In the following screenshot I am showing the ContrainerStatus facet selected. Adding this facet would show any pods that have a terminated status. By clicking on Apply & Run the facet will be added to the current query and then it will be run updating the results.
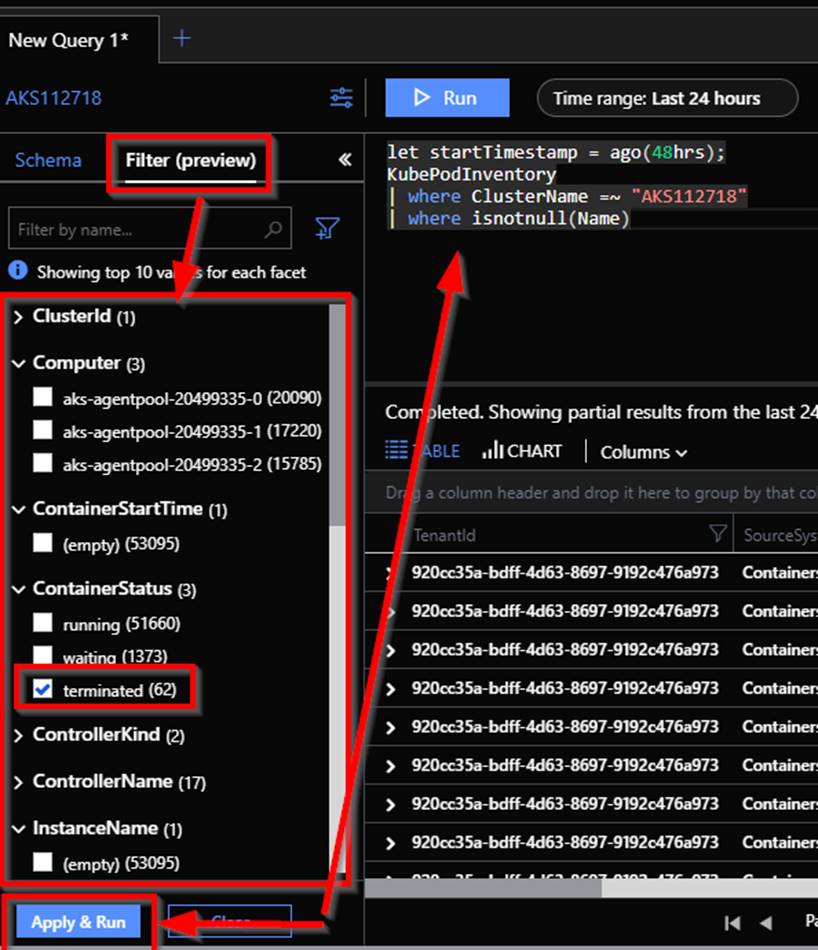
The following screenshot shows what the query looks like with the ContainerStatus facet with a value of terminated added.
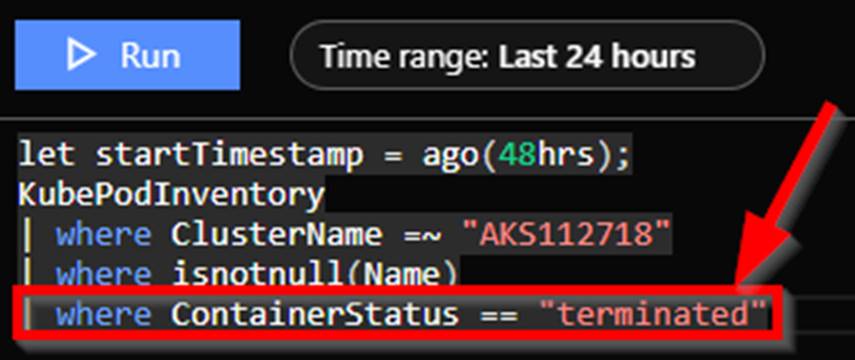
On the Log Analytics search page you can build queries to pull back specific data. Here are some example queries.
Pods that have a restart count greater than 0 in the last 48 hours
let startTimestamp = ago(48hrs);
KubePodInventory
| where ClusterName =~ "AKSCLUSTERNAME"
| where ContainerRestartCount > 0
| where isnotnull(Name)
Container lifecycle
ContainerInventory
| project Computer, Name, Image, ImageTag, ContainerState, CreatedTime, StartedTime, FinishedTime
| render table
Kubernetes events
KubeEvents_CL
| where not(isempty(Namespace_s))
| sort by TimeGenerated desc
| render table
If you are not familiar with the Log Analytics query language you can go here to get up to speed: https://docs.microsoft.com/en-us/azure/azure-monitor/log-query/query-language
Also in the Log Analytics search page you can save queries for later use, copy a link directly to the query for sharing, setup alerts based on conditions, and pin a chart to a shared Azure dashboard like shown in the following screenshot.

Kubelet Logs
If something goes wrong with a node a good portion of the troubleshooting can be done using the node monitoring provided in Azure Monitor. If you need to go beyond Azure Monitor you can utilize the kublet logs. You can view the kubelet logs from any of the AKS nodes using journalctl. To do this you need to first SSH to the cluster node you want to see the logs on. Once connected via SSH run
sudo journalctl -u kubelet -o cat
That will start rolling through the kubelet logs so you can have further insight into what is happening on the node.
Kubernetes Master Node Logs
In AKS the Kubernetes master node logs are not collected by default. These logs are not collected because Microsoft manages the Kubernetes master nodes and therefore you typically do not have to worry about troubleshooting the master nodes. In the event that there is a need to see logs from any of the master nodes log collection can be turned on so that they are sent to a Log Analytics workspace.
To enable the master node log collection in the Azure portal navigate to the AKS resource group. NOTE do not go to the AKS resource group with this name format MC_ResourceGroupNAME_AKSClusterNAME_REGION. Once in the AKS resource group click on Diagnostics Settings. Click on the AKS cluster.

Then click on turn on the diagnostics.

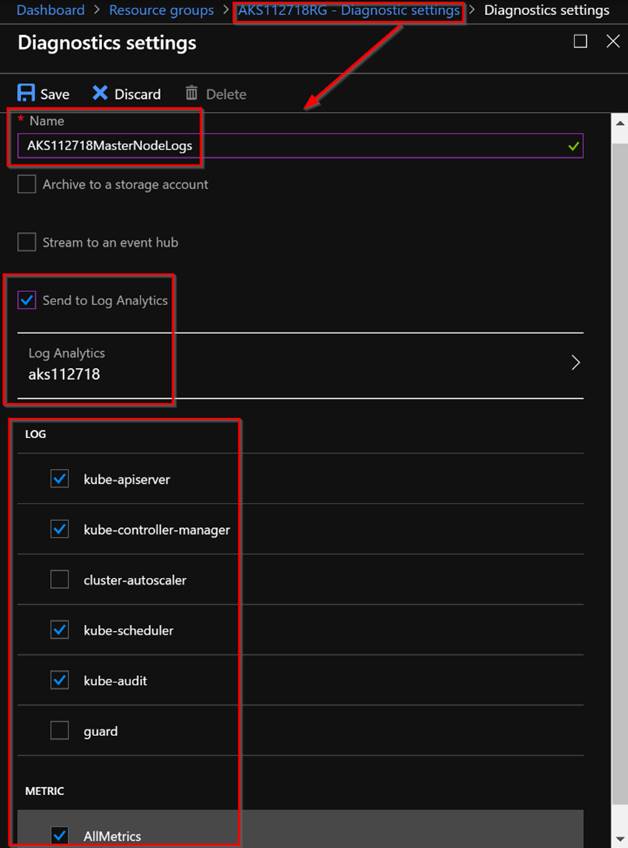
Configure the diagnostics settings like in the following screenshot to send the logs to a Log Analytics workspace. You will give the diagnostics collection a name, select or create a new Log Analytics workspace and select the master nodes that you want to collect logs from.
After you save the diagnostics log settings you should now see this set on the AKS resource group like shown in the following screenshot.

To see the actual logs go to the Log Analytics workspace that you sent the logs to and run a search query like shown in the following screenshot.

You can run one of the following search queries to see logs from the Kubernetes master nodes:
AzureDiagnostics
| where Category == "kube-apiserver"
| project log_s
AzureDiagnostics
| where Category == "kube-controller-manager"
| project log_sAzureDiagnostics
| where Category == "kube-scheduler"
| project log_sAzureDiagnostics
| where Category == "kube-audit"
| project log_sAzureDiagnostics
| where Category == "guard"
| project log_sAzureDiagnostics
| where Category == "cluster-autoscaler"
| project log_sKubernetes Dashboard
In the Kubernetes dashboard you will also find health and performance information as well that could help identify and troubleshoot issues. The purpose of this blog was to show the monitoring capabilities available in Azure for AKS. I will show some of the options available in the Kubernetes dashboard but will not go deep into monitoring and logging available directly in Kubernetes.
Inside the Kubernetes dashboard on the overview page you will see all up health and performance of the cluster, services, pods, and more. As you can see in the following screenshot there is an issue spanning across the deployments, pods, and replica sets.

As we drill into the Pods page we can see that there is a container that is constantly restarting and is in a failed state. That is the cause of the issues on the overview dashboard shown across the deployments, and replica sets. We can remove this pod and re-deploy it.


For more information about monitoring and logging directly in Kubernetes visit this link: https://kubernetes.io/docs/tasks/debug-application-cluster/core-metrics-pipeline
Thanks for reading. Be sure to check out my other blogs related to Azure Kubernetes Service here: https://www.buchatech.com/category/opensource/kubernetes

1 thought on “Monitoring Azure Kubernetes Service (AKS) with Azure Monitor & Log Analytics”