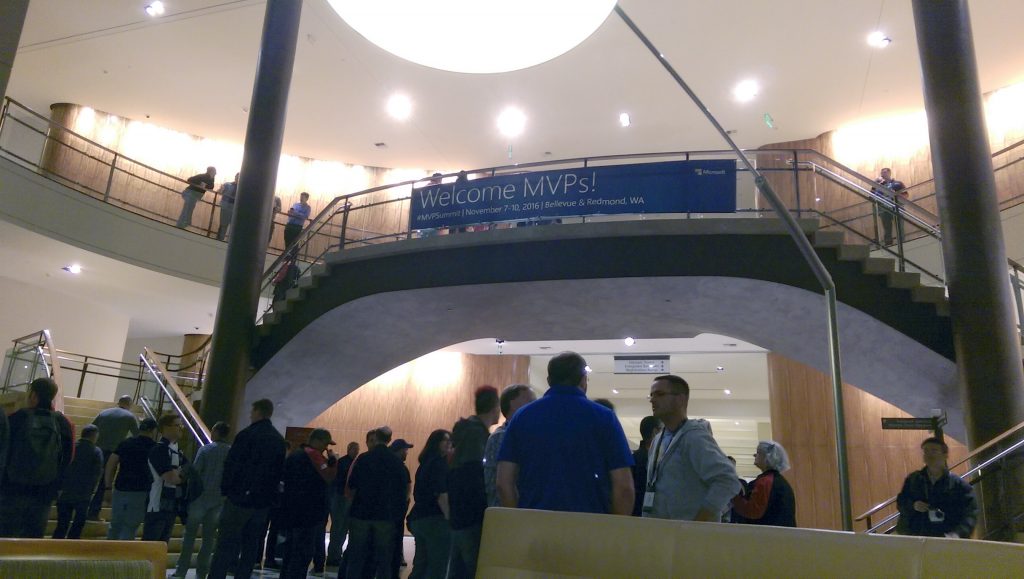
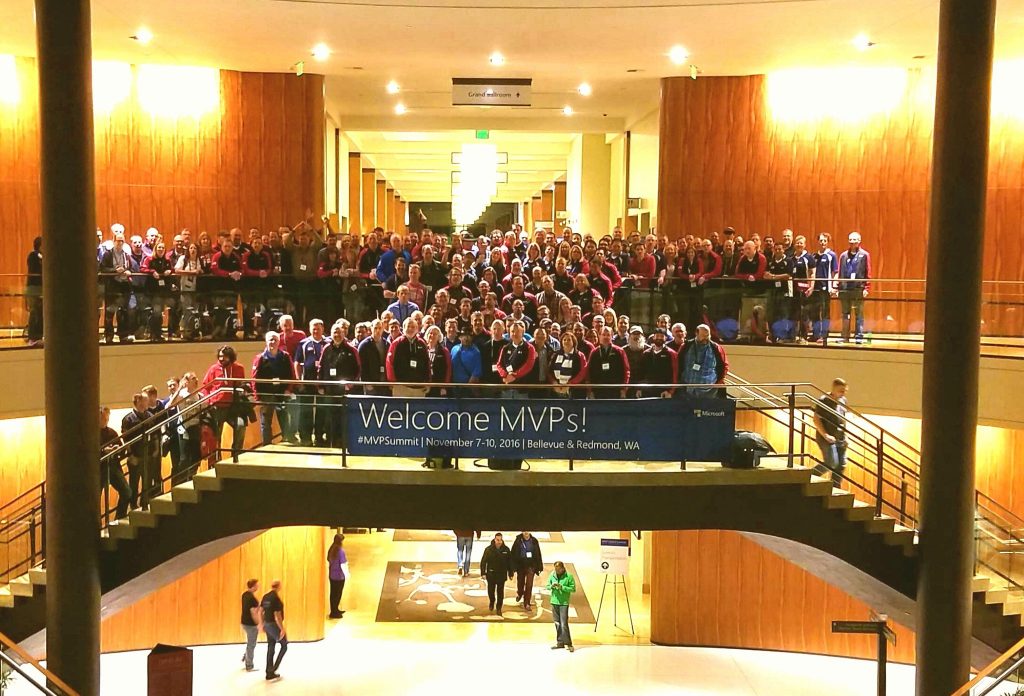
I recently had the opportunity to present at the annual SCOM/OMS Day held by the MN System Center user group. Here is a link to the past event https://mnscug.org/meetings/499-october-2017-mnscug-meeting. Other presenters during this event included Microsoft MVP Cameron Fuller, Microsoft MVP Bob Corenelissen, and Nathan Foreman, another Minnesota local. I chose to present on Monitoring Azure PaaS. In this blog post I will cover the information from my presentation and dive deeper into the topic.
Defining PaaS
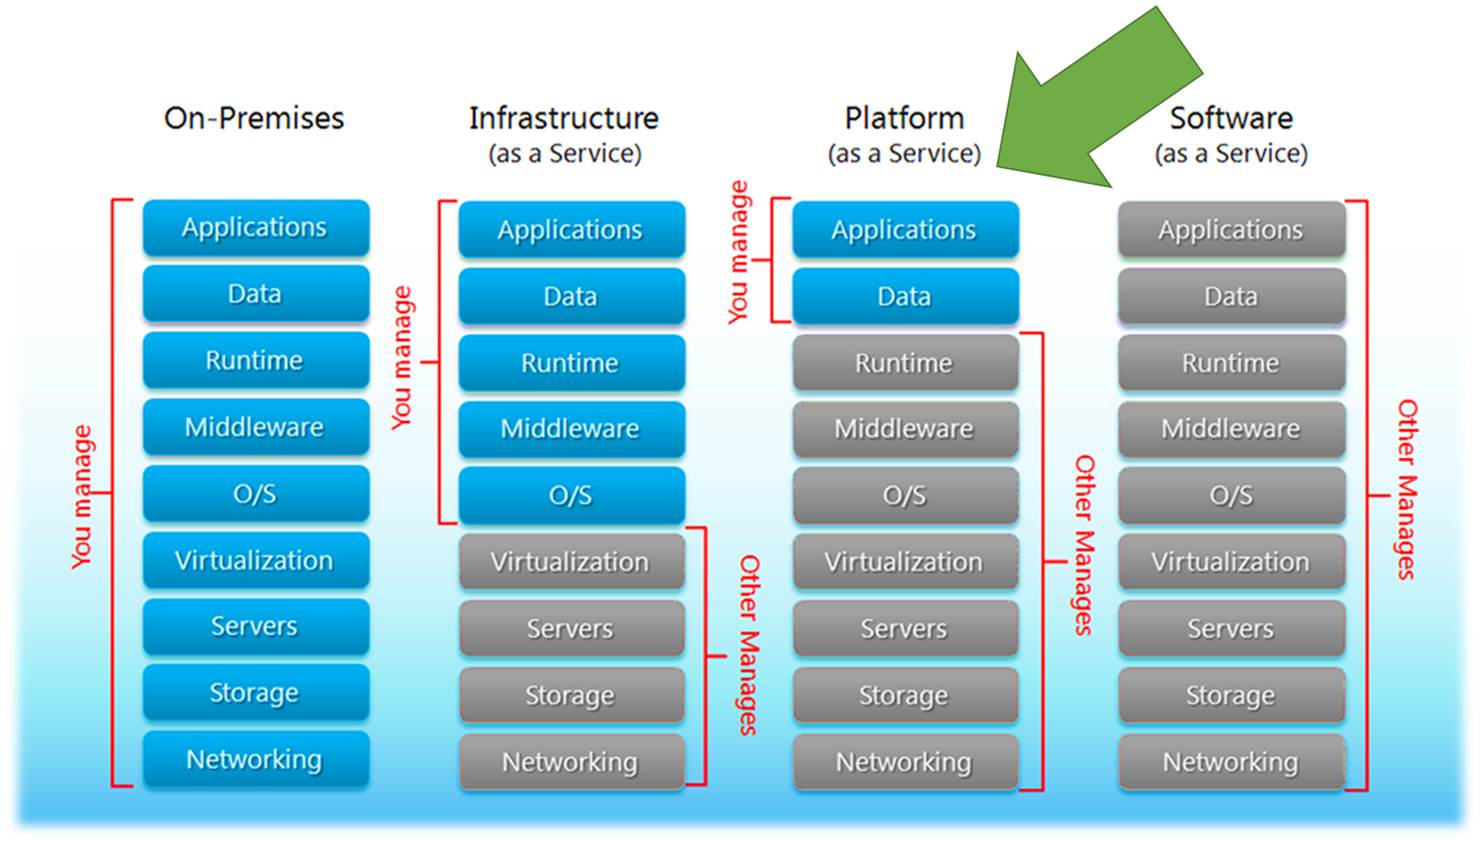
Before you can monitor something you need a full understanding of what it is that you will be monitoring. Let’s start out by clarifying what PaaS is. There are many facets to cloud and the services that are available in cloud. You also can utilize public cloud, run your own private cloud or utilize a combination of the two known as hybrid cloud. Regardless if you have public, private, or hybrid cloud you can leverage Infrastructure as a Service (IaaS), Platform as a Service, and Software as a Service. Below is an image that has been around for a while that visually explains the main differences between running your own data centers and utilizing cloud.

After viewing the previous image lets dive a little bit deeper into what it is explaining. When you run your own data center/s you are responsible for EVERYTHING all the way down to the networking and storage including monitoring all of that. As you move to the cloud you reduce your administrative overhead releasing that to the cloud vendor.
Most organizations first foray into cloud is to utilize IaaS. With IaaS you take a lift and shift approach of essentially running your existing servers and or new servers in cloud as virtual machines. At this layer you no longer have to worry about and manage the hypervisor, servers, physical storage, and physical networking. At the IaaS layer you still need to manage and monitor what is running on the servers that power workload and applications consisting of things like the OS, middleware, data and the applications. You also manage and monitor software defined storage and networking.
As organizations move to PaaS in cloud you release even more to the cloud vendor reducing even more administrative overhead. Also with PaaS the cost of the cloud services decreases. With PaaS you are responsible for the applications and data. You no longer need to worry about maintaining the administrative tasks of the applications, middleware or the OS.
Examples of some Azure PaaS services are Web Apps, Mobile Apps, API Apps, Media Services, CDN, Search, Event Hubs, Notification Hubs, Service Bus, Batch service, Azure AD, B2B/B2C, Azure DNS, Storage, SQL/MySQL/Postgres databases, CosmosDB, Service Fabric, IoT, Azure Functions, Logic Apps, Azure Container Service, Redis Cache, HD Insight, Key Vault, Azure Bot service, and much more.
Let’s zero in on SQL as a service in the cloud. With traditional SQL you had to properly scope and size the server properly, ensure you have enough storage space, split data, logs etc. After that you would need to plan and make SQL highly available, tune a SQL server for performance, maintain it and more. With PaaS the majority of this goes away. In fact with PaaS there is no SQL server/s to manage anymore. With PaaS when developers or anyone in IT need a SQL database they simply go spin it up. IT can still put controls in place such as policy and governance standards that are essentially boundaries that the consumer of the service needs to stay within however it is all self-service.
Now even though SQL databases can be spun up by consumers on their own and the SQL servers are managed by the cloud vendor (Microsoft). Now you would think in a cloud PaaS model you no longer need to monitor as there is no SQL server/s to administer. This is simply not true and we will get more into the monitoring aspect more later on in this post.
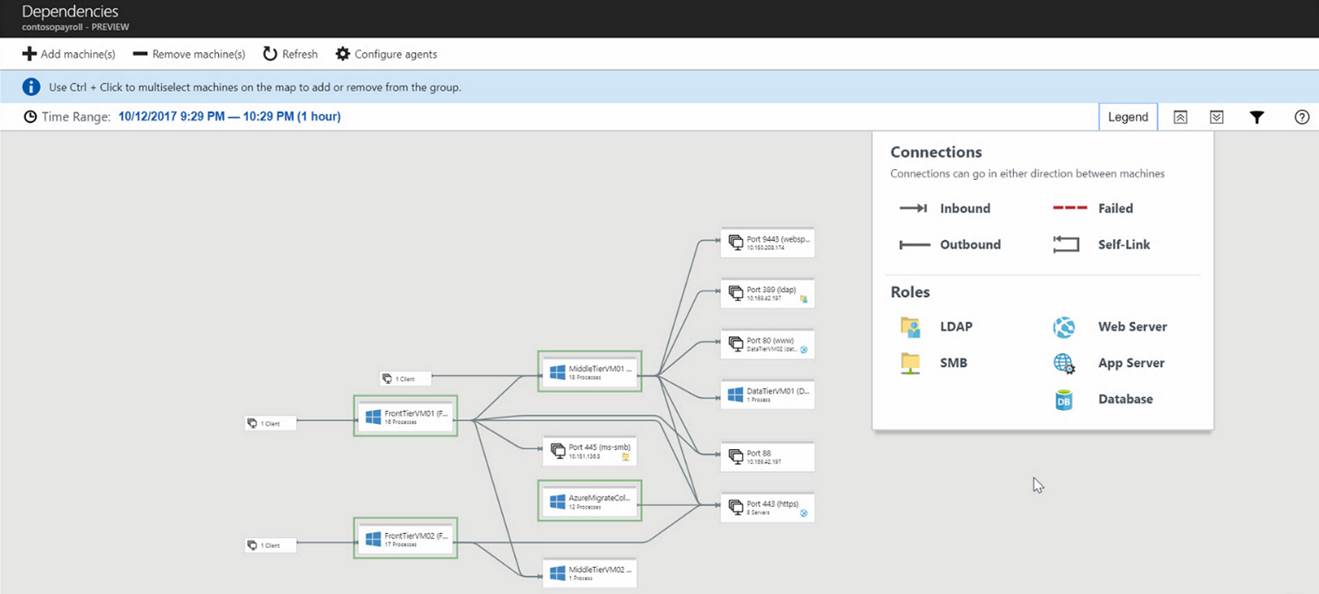
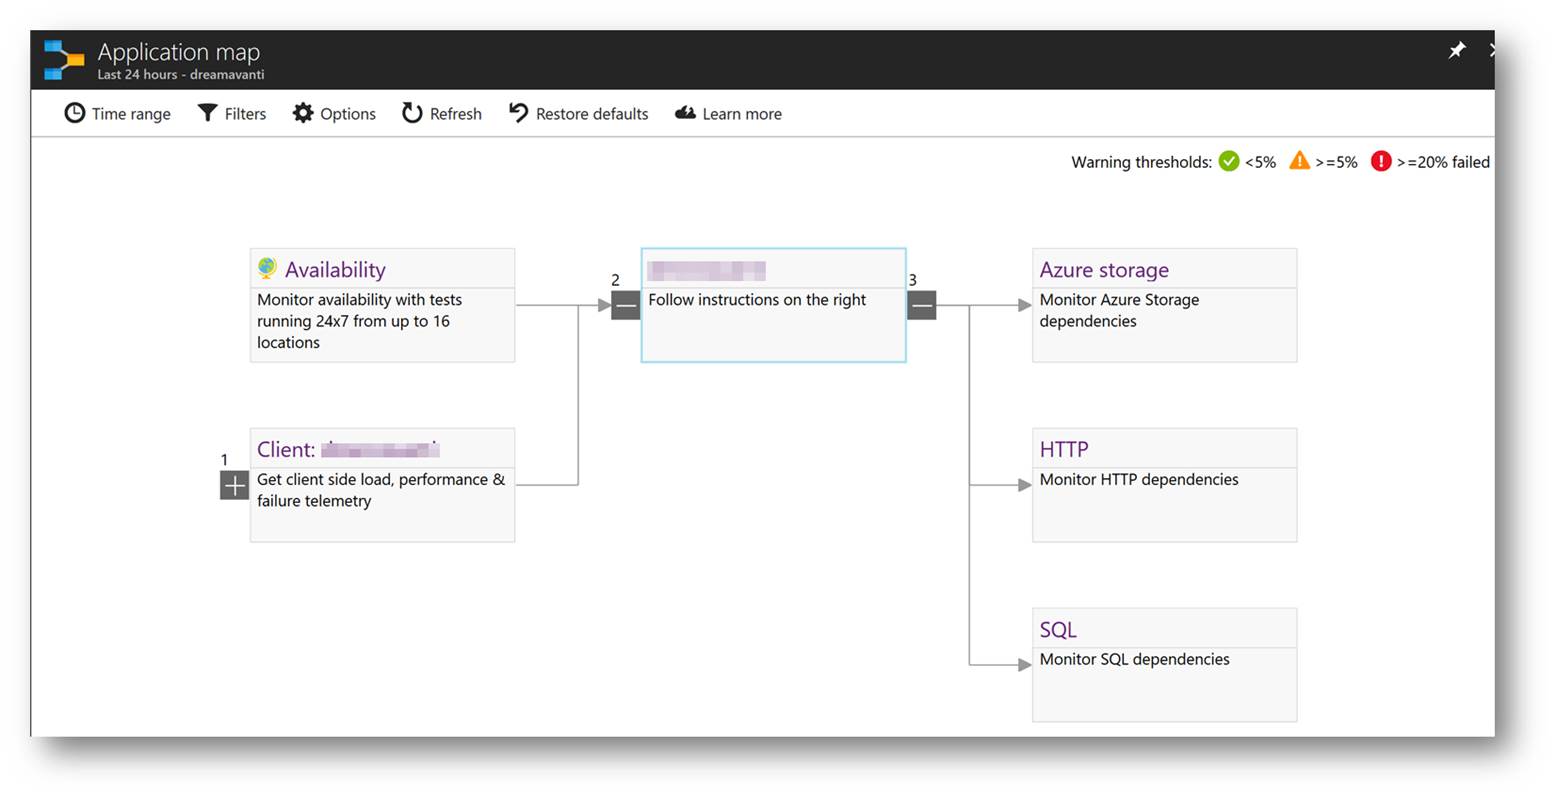
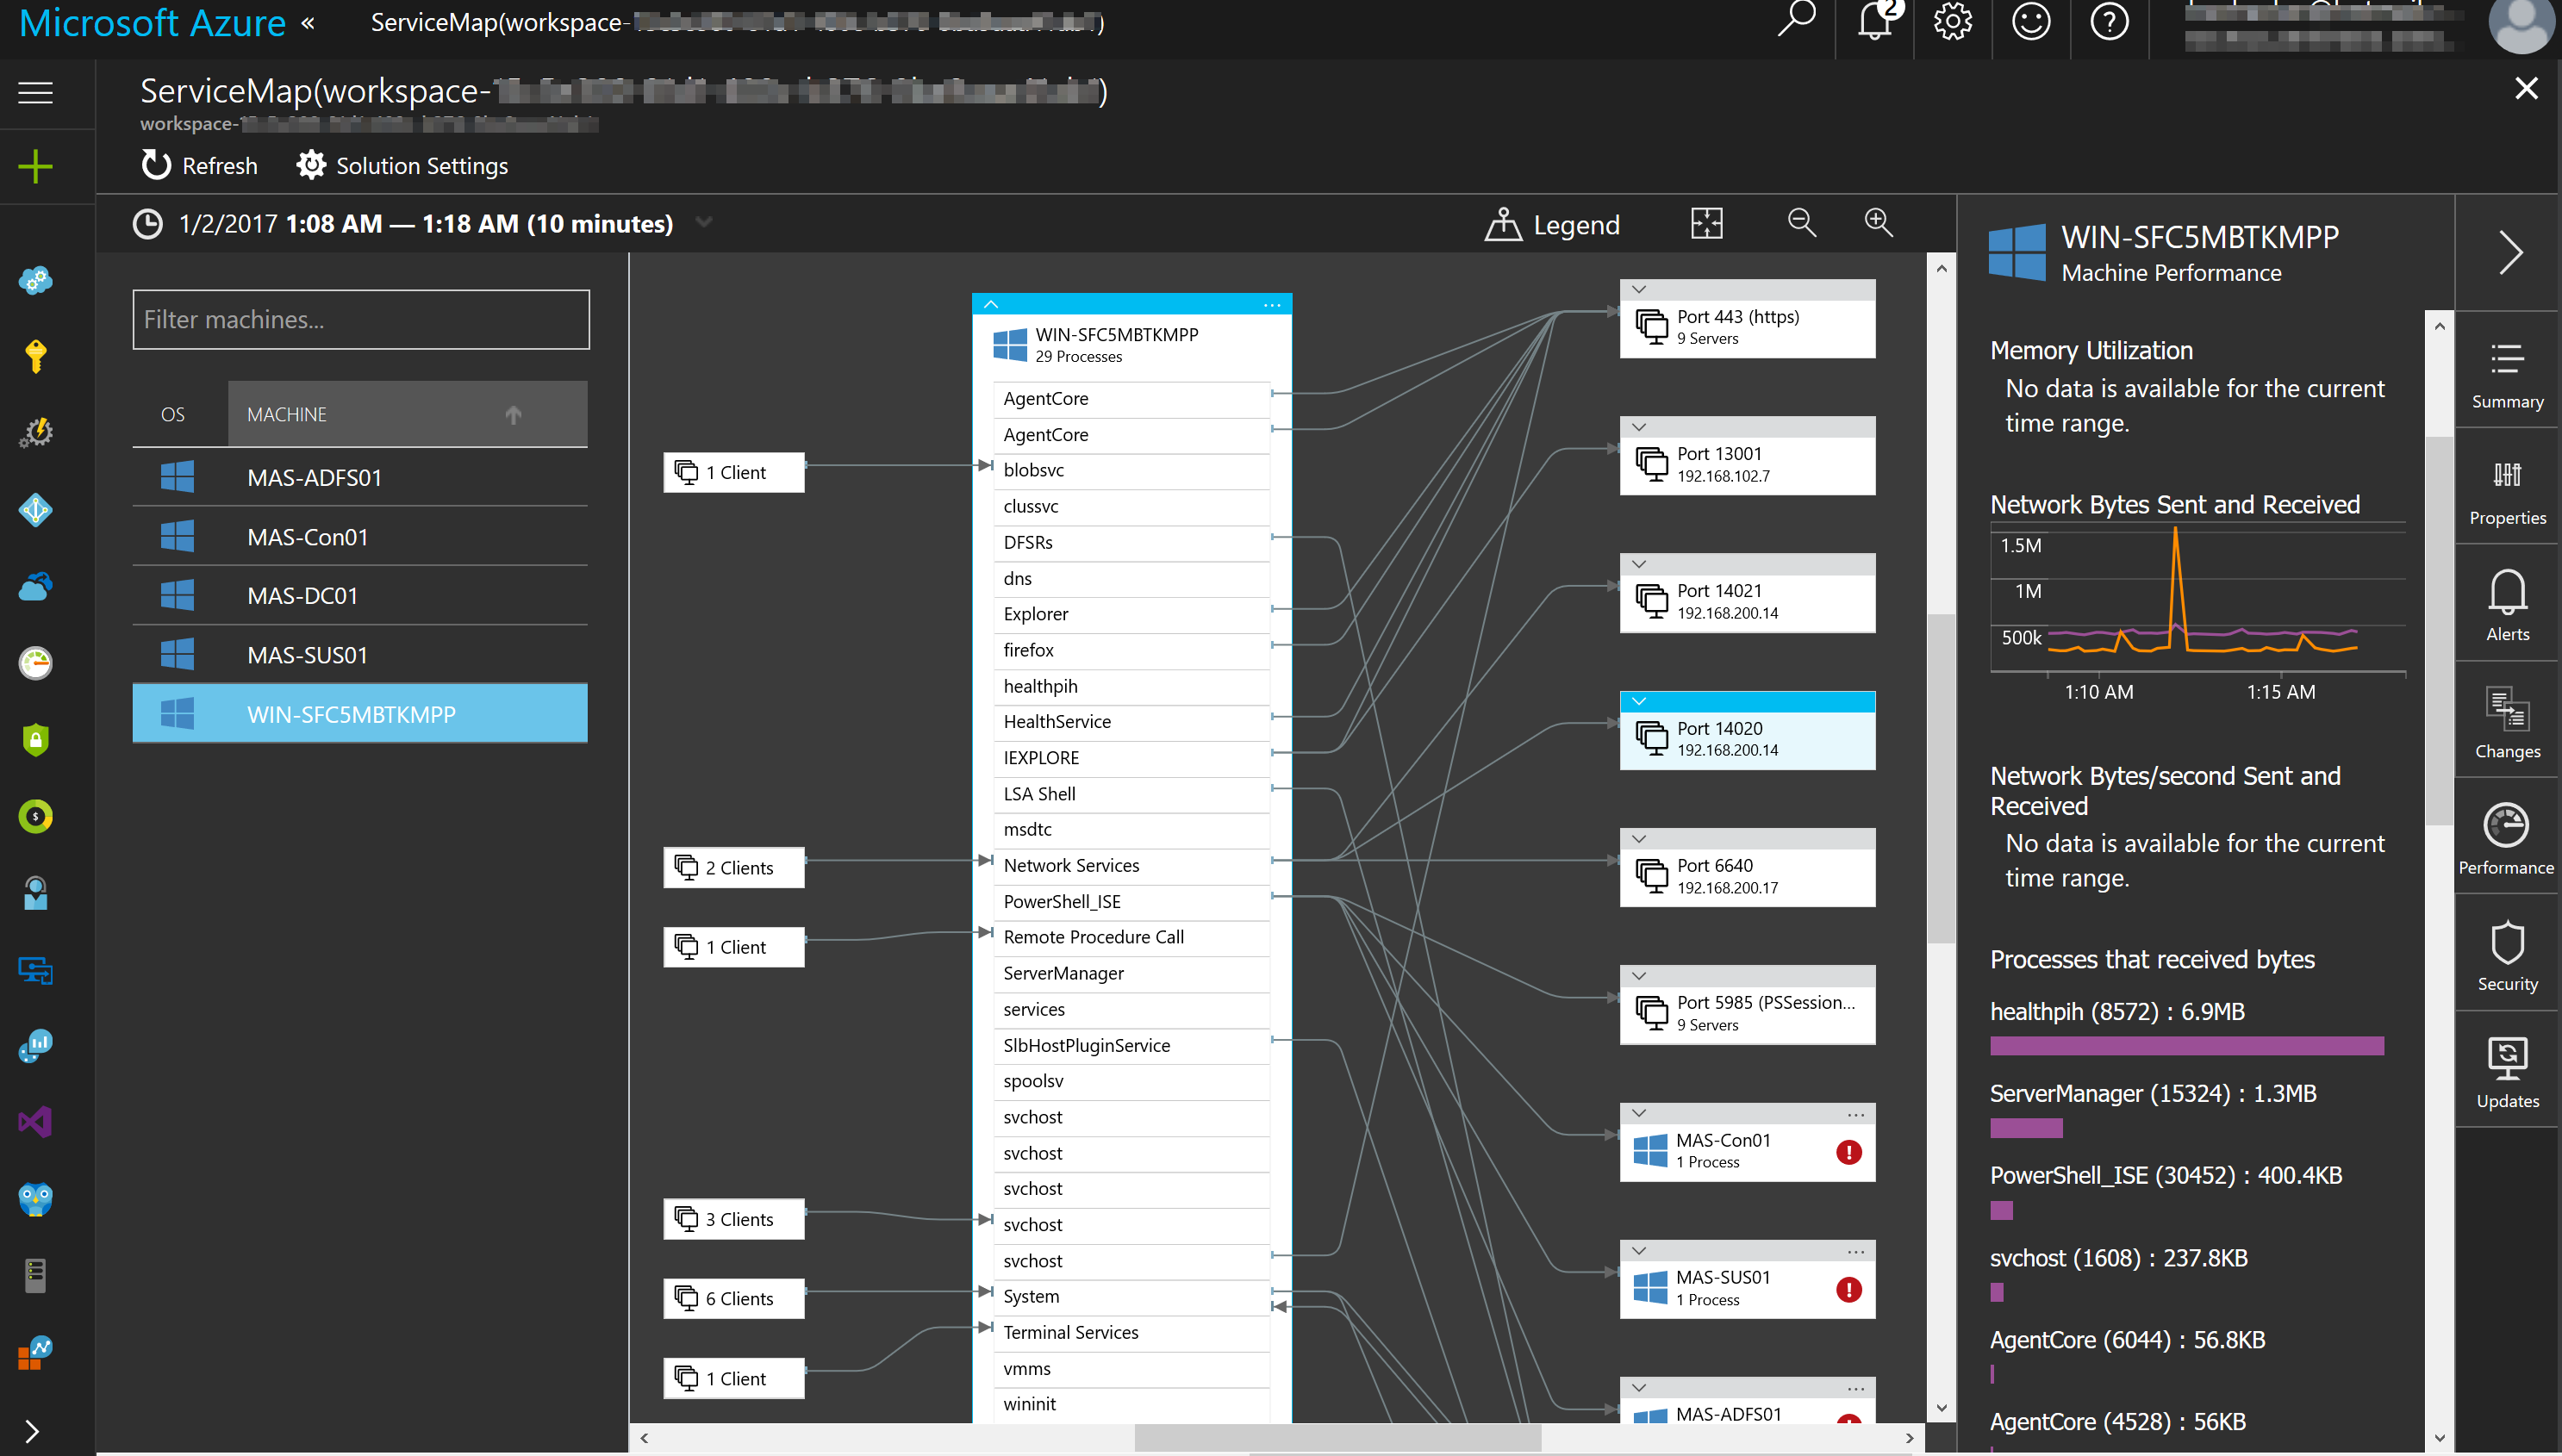
Applications running in Azure are typically made up of multiple PaaS services and sometimes a PaaS service itself will have dependencies on other PaaS services. An example of this can be seen in the following Application Map. This shows that PaaS services have many moving parts across multiple parts and can be complex.
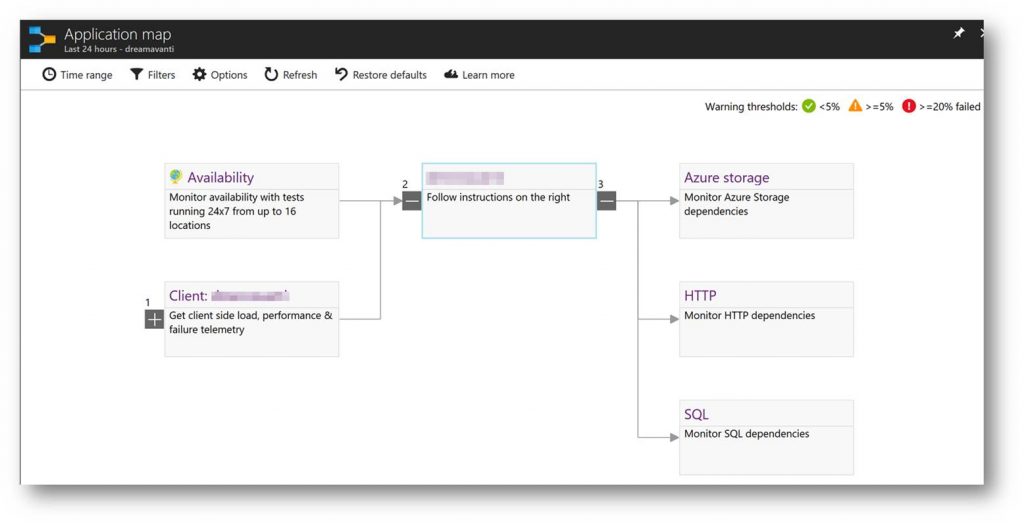
With PaaS components that make up applications it is important not to just monitor the components but also the application itself.
Why Monitor PaaS?
Most folks automatically think that they don’t need monitoring of PaaS because they assume without servers and high availability they don’t need to. This simply is not true. Below is a list of reasons of why it is important to monitor PaaS.
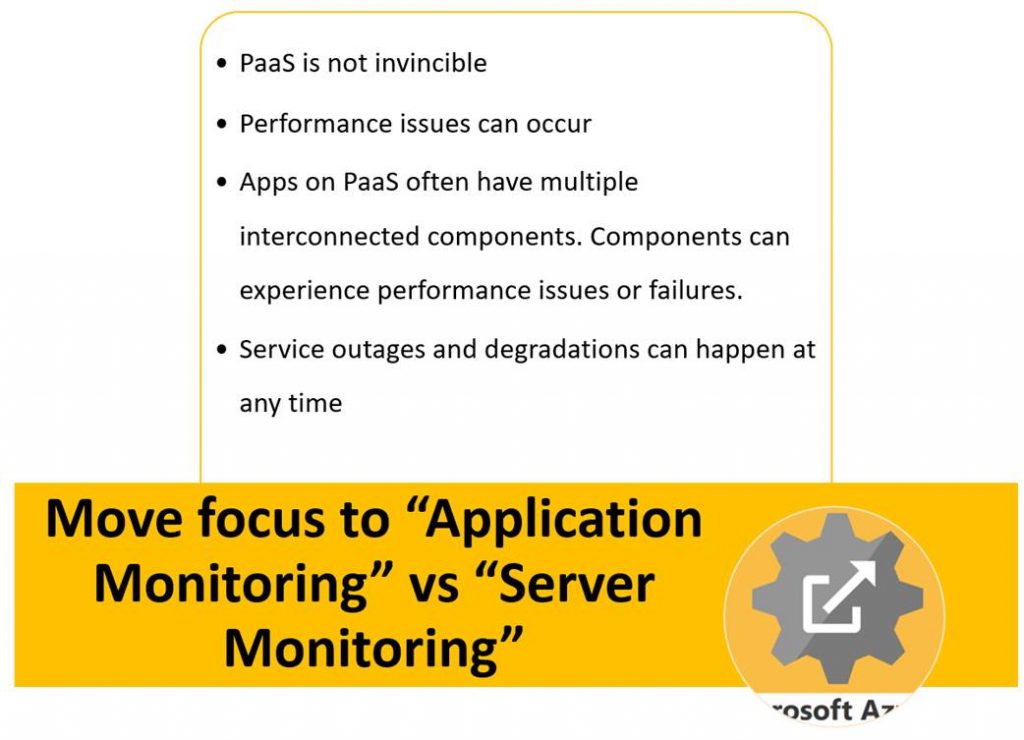
Overall when it comes to PaaS best practice is to move away from the old ways of thinking and methods for monitoring servers and on-premises infrastructure and move to a focus of monitoring the business applications.
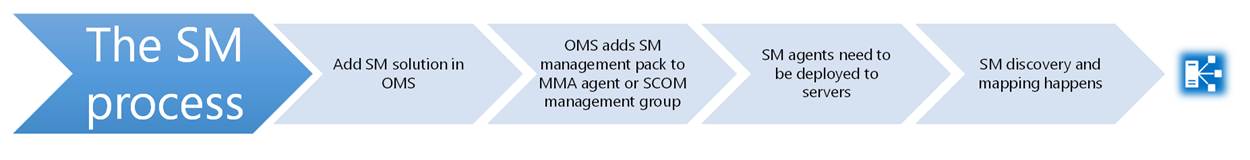
Understanding the monitoring framework in Azure
Next up let’s take a look at the framework of monitoring in Azure. This will help you to better understand what is possible and how the monitoring tools plug into this framework. There are three main areas of data that is generated by Azure services that can be leveraged in monitoring. These sit across IaaS and PaaS services. These areas are:
- Diagnostic
- Logs emitted by an Azure resource that provide rich, frequent data about the operation of that resource.
- Resource-level diagnostic logs require no agent and capture resource-specific data from the Azure platform itself.
- Can send these to OMS Log Analytics, Event Hubs, or an Azure Storage account.
_______________________________
- Metrics
- Gain near real-time visibility into the performance and health of Azure workloads.
- Performance counters are emitted by most Azure resources.
_______________________________
- Activity Log
- Insight into subscription-level events that have occurred in Azure.
- Determine the ‘what, who, and when’ for any write operations (PUT, POST, DELETE) taken on an Azure resource in a subscription.
- Categories of data: Administrative, Service Health, Alert, Autoscale, and Recommendation. (Policy, Security, and Resource Health coming…)
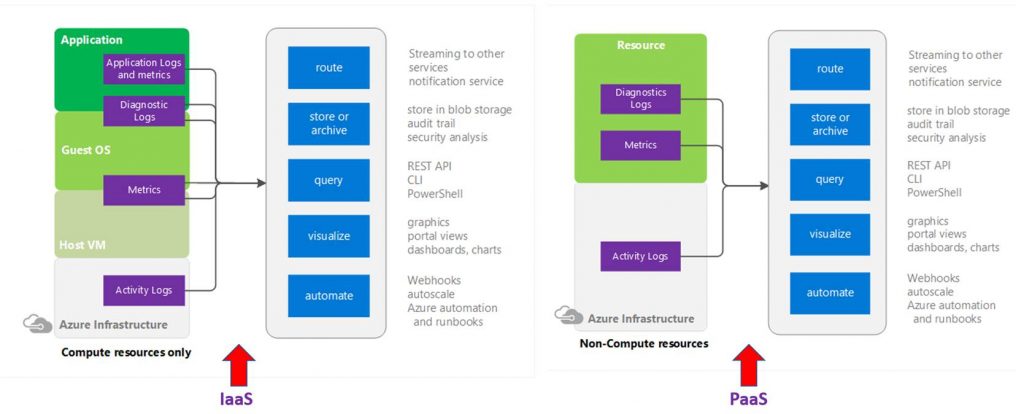
The types of monitoring data sit at different layers on IaaS and PaaS. On IaaS the application logs and metrics come directly out of the application. Diagnostic logging sits across the application and OS layer while metrics sit across the OS layer and VM layer. The activity logging sits at the Azure infrastructure layer.
On PaaS both the diagnostic logging and metrics come from the Azure resources directly. The activity logs again are at the Azure infrastructure layer.
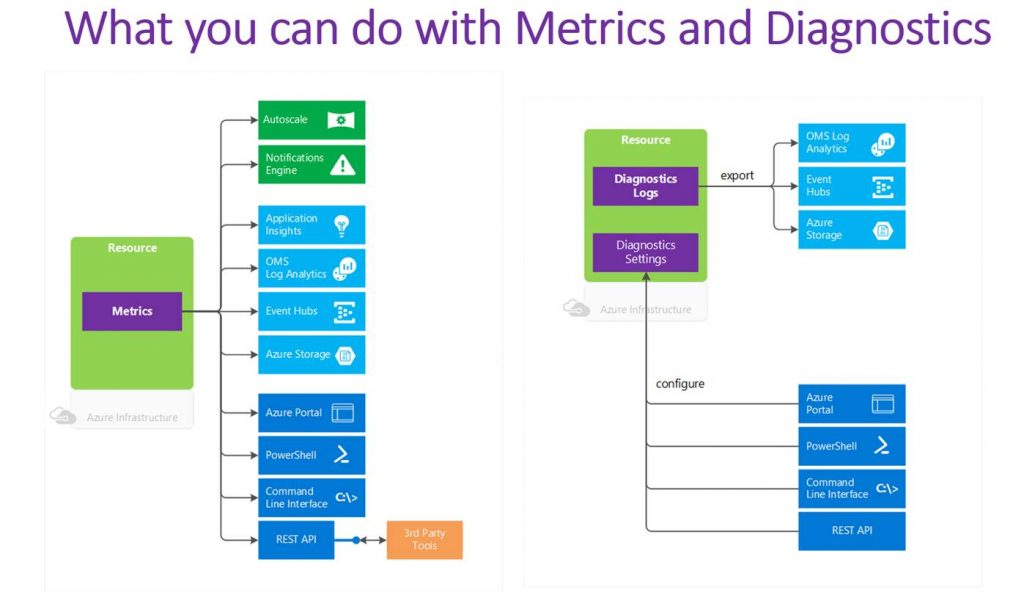
With the diagnostic logs and metrics you can access and configure these via the Azure portal, PowerShell, Azure CLI and many have API.
Diagnostic logs can be sent to OMS log analytics, Event Hubs or Azure storage for other consumption. Metrics can also be sent to OMS log analytics, Event Hubs, Azure storage, and Application Insights. With Metrics you can also fire off alerts and autoscale a service. Alerts can kick off emails, webhooks, and Azure Automation runbooks. The following diagrams visually breakdown what can be done with metric and diagnostic log data.
Options for monitoring Azure PaaS
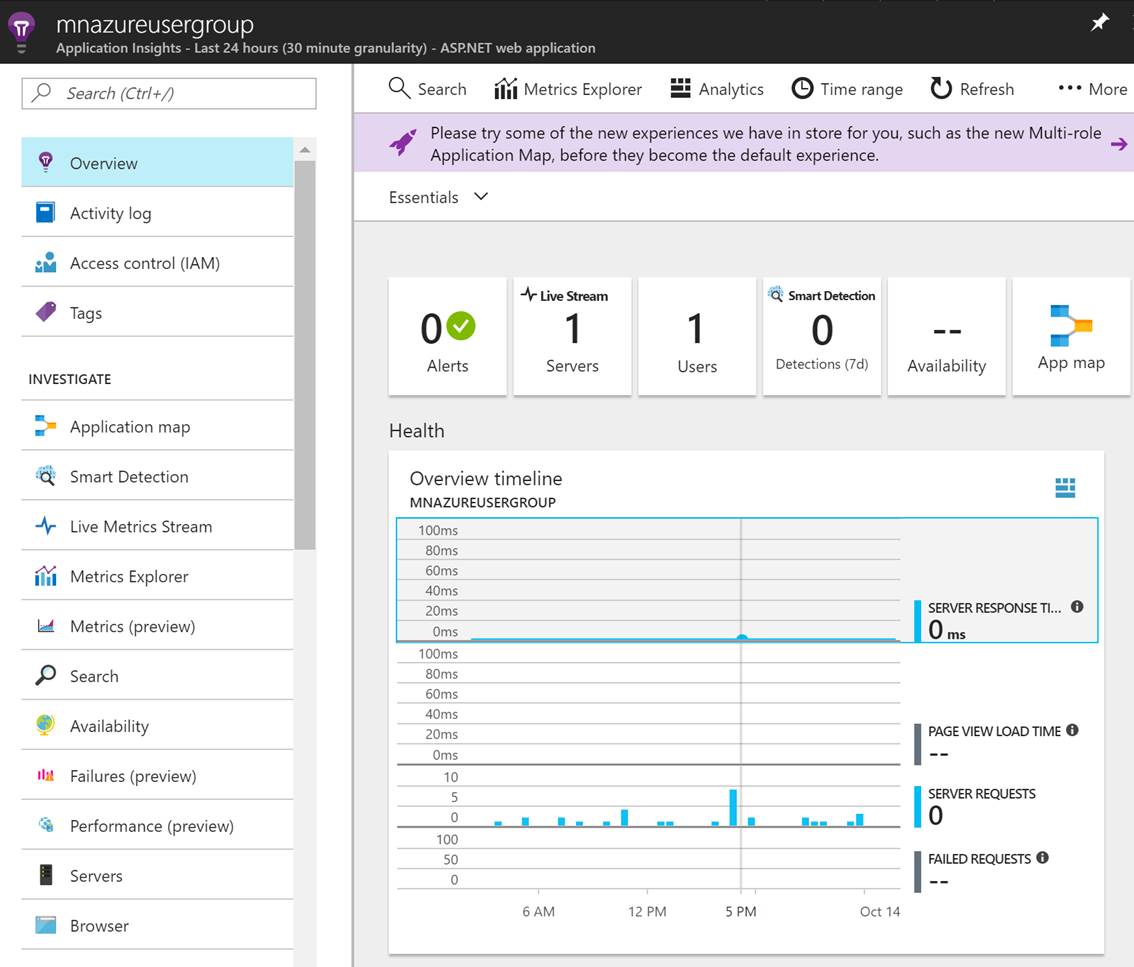
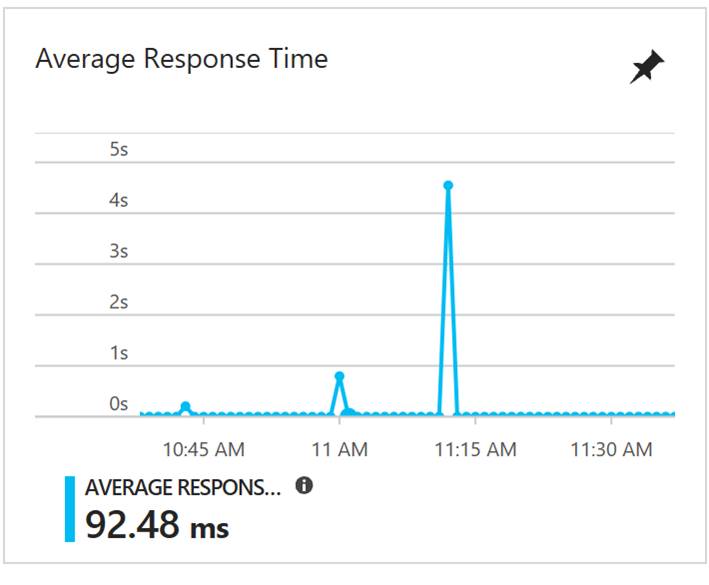
When it comes to monitoring PaaS Microsoft has many options available. There also are options available from a ton of 3rd party vendors. In this blog post I will only talk about the Microsoft options. Majority of the monitoring tools from Microsoft that can monitor PaaS are cloud based but you also can do some PaaS monitoring via System Center Operations Manager. The cloud options are much faster, easier to onboard and have been built from the ground up with cloud in mind. With Azure you also have out of the box monitoring capabilities on most of the Azure services. For example with a web app in Azure on the overview blade you can see things like data in and out and the Azure Response Time as shown in the following screenshot.
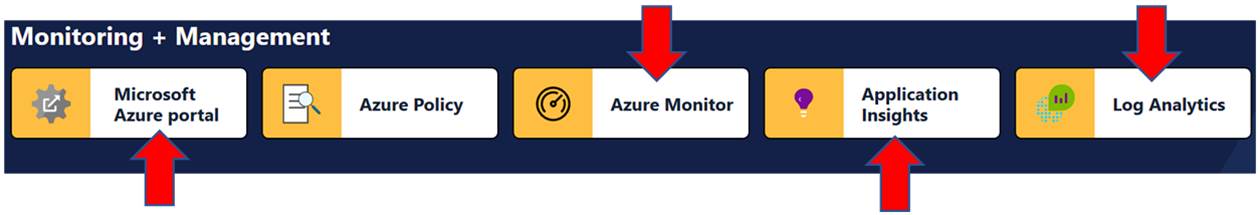
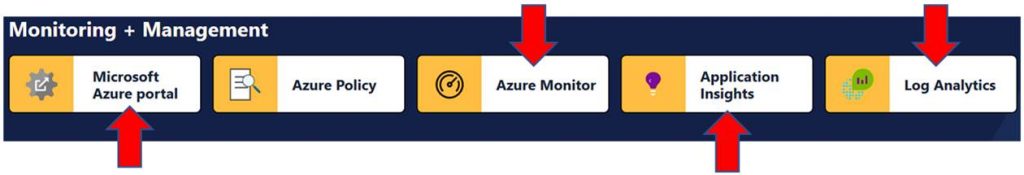
It is great that we get some monitoring out of the box for PaaS services, however this does not help when you are running hundreds+ of services. To handle enterprise scale monitoring of PaaS services you need to centralize the monitoring and that is where the monitoring solutions come in. Microsoft has 4 cloud based monitoring tools to help centralize your Azure monitoring. These tools are able to scale as needed without any hard limits. SCOM is a 5th monitoring tool that can monitor Azure. SCOM is on-premises only though. Here is a screenshot of the various tools minus SCOM:
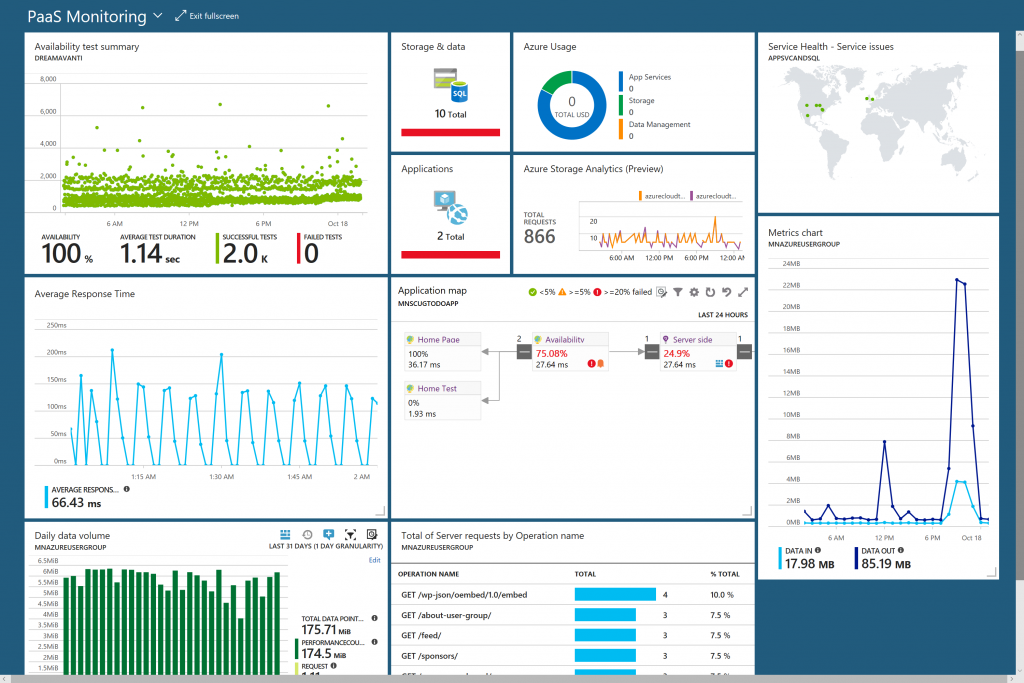
Here is an example custom PaaS monitoring dashboard in Azure combining widgets from the various monitoring tools:
Now let’s dive into what each tool is and an example of when and how you would use them to help monitor Azure PaaS services.
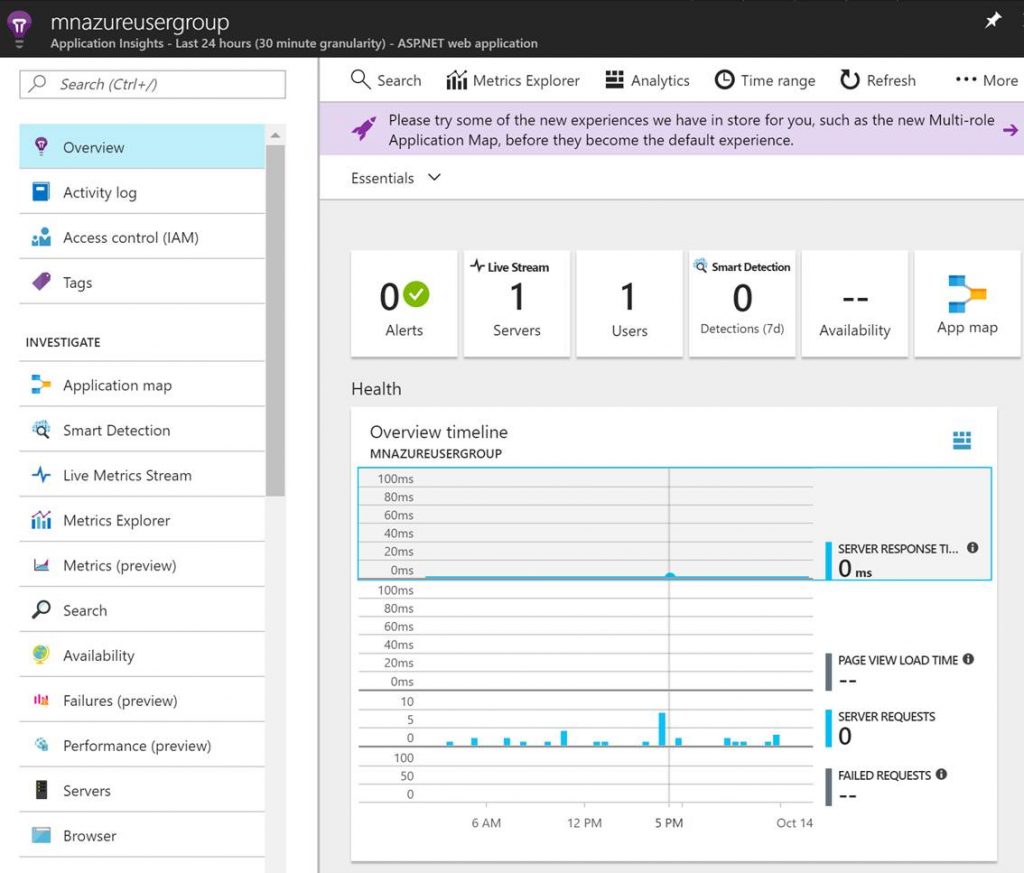
Application Insights is a Application Performance Monitoring (APM) solution used to monitor applications all the way down to the code. Application Insights is typically used for web apps and other Azure PaaS services to detect, triage, and diagnose the root cause of issues. Application Insights gives you the ability to monitor many things about your applications such as availability, metrics like data coming in and out, dependency mappings through application map, performance data, and even live streams of data points. The following screenshot is an example of a web app in Application Insights.
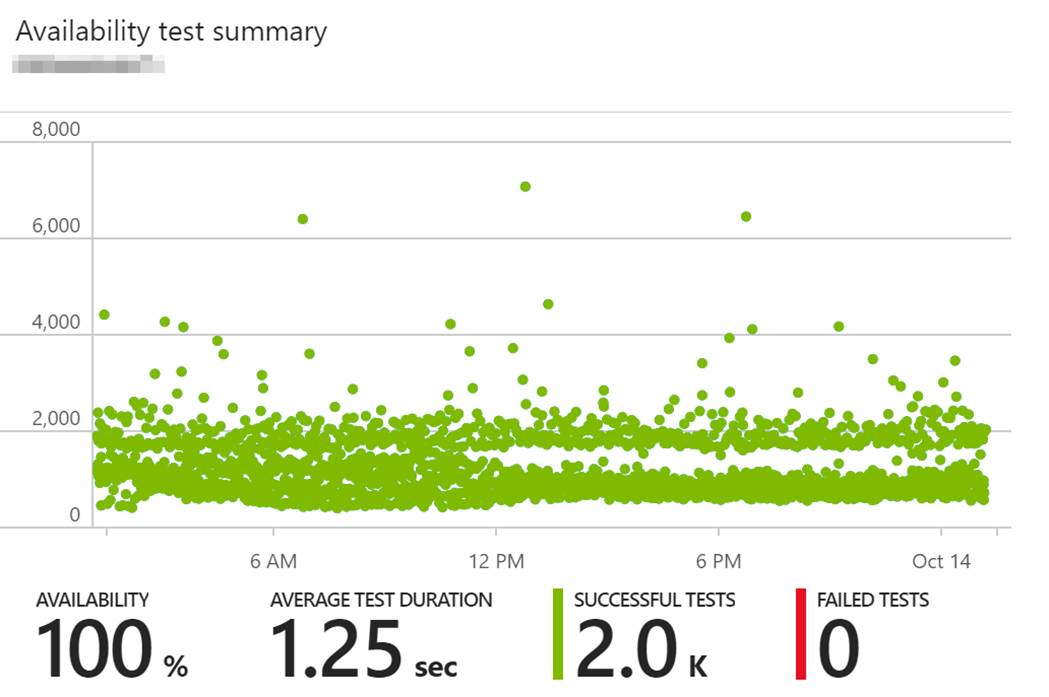
The following screenshot is an example of an availability test summary chart in Application Insights. It is a ping test pointed to a URL. It gives you the % of the apps availability, the successful tests and failures.
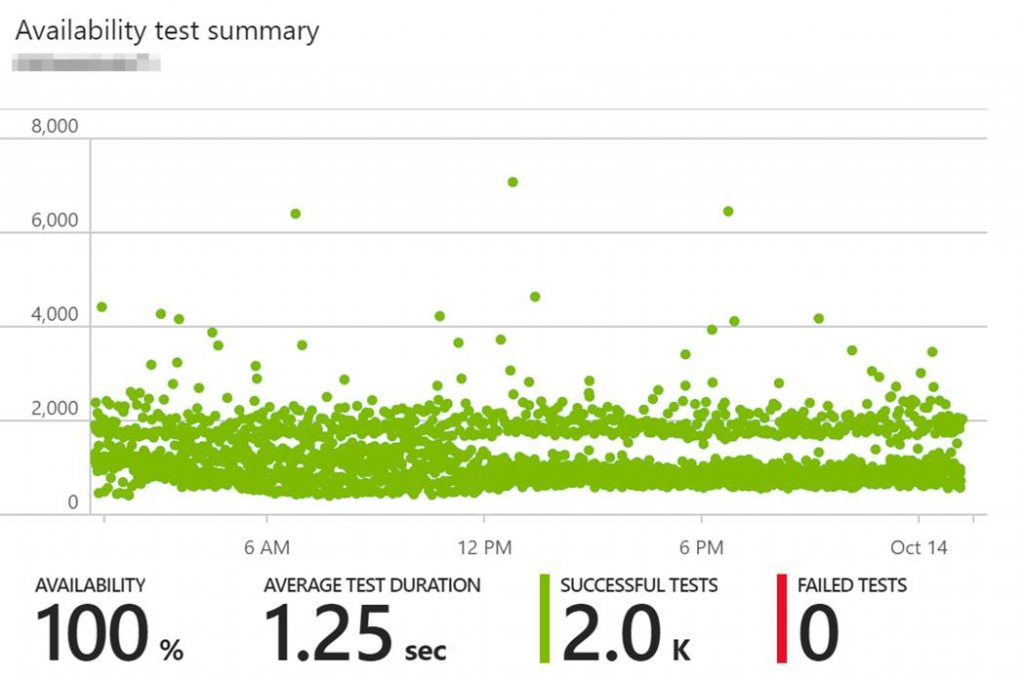
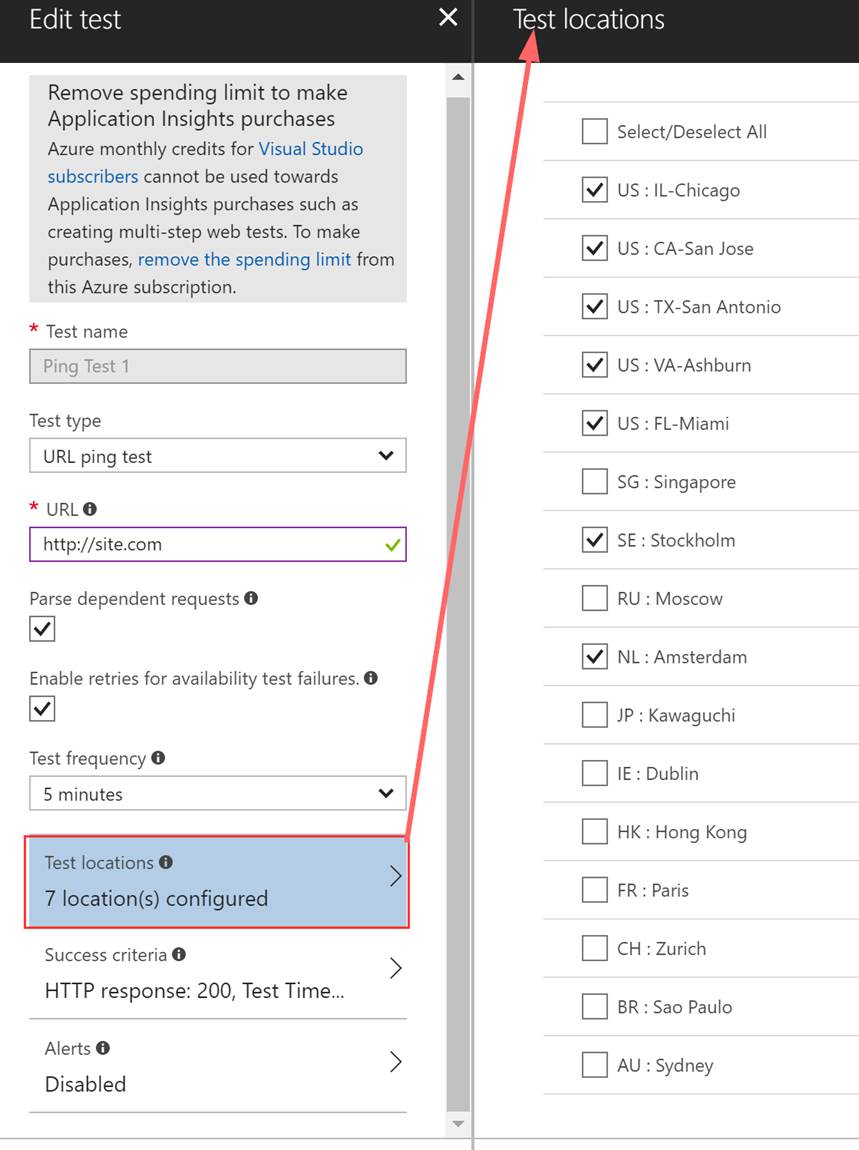
With the availability ping test you have control over a bunch of options such as the frequency, success criteria, any needed alerts upon failures, and the ability to select the locations the test runs from.

Here is an Example use case for Application Insights:
- Debug a multi-tier Azure .NET web application for errors and performance issues.
- Utilize Application Map in Application Insights to discover visually which parts of the application are unhealthy. For the parts that are not healthy drill down using Application Insights to pinpoint the root cause of the errors.
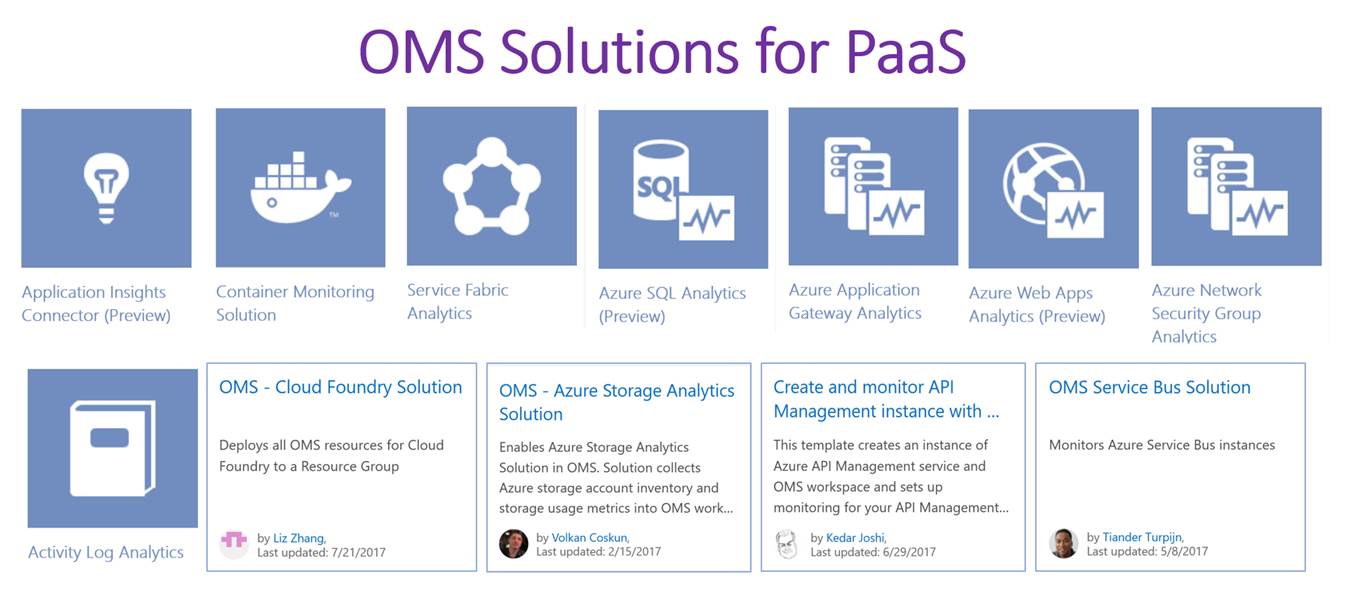
OMS stands for Operations Management Suite. OMS is goes beyond just a tool that can be used for monitoring. It is a suite that also provides, backup, DR, automation and security. It extends to on-premises and it can monitor both IaaS and PaaS. OMS is a platform and has something called solutions. Solutions are used to extend the functionality of OMS. The solutions are packaged management scenarios. I am not going to list out or dive into all of the solutions available for OMS here. Solutions can be found directly in OMS or from the Azure Marketplace. There are a bunch of OMS solutions that can be used to help monitor and gain insight into your Azure PaaS services. The following screenshot has some of the PaaS related solutions that are available for OMS.

In the previous screenshot the OMS solutions with the white background can be found in the Azure Marketplace while the other OMS solutions will be found directly in OMS. More and more solutions are being added to OMS and the Azure Marketplace all the time.
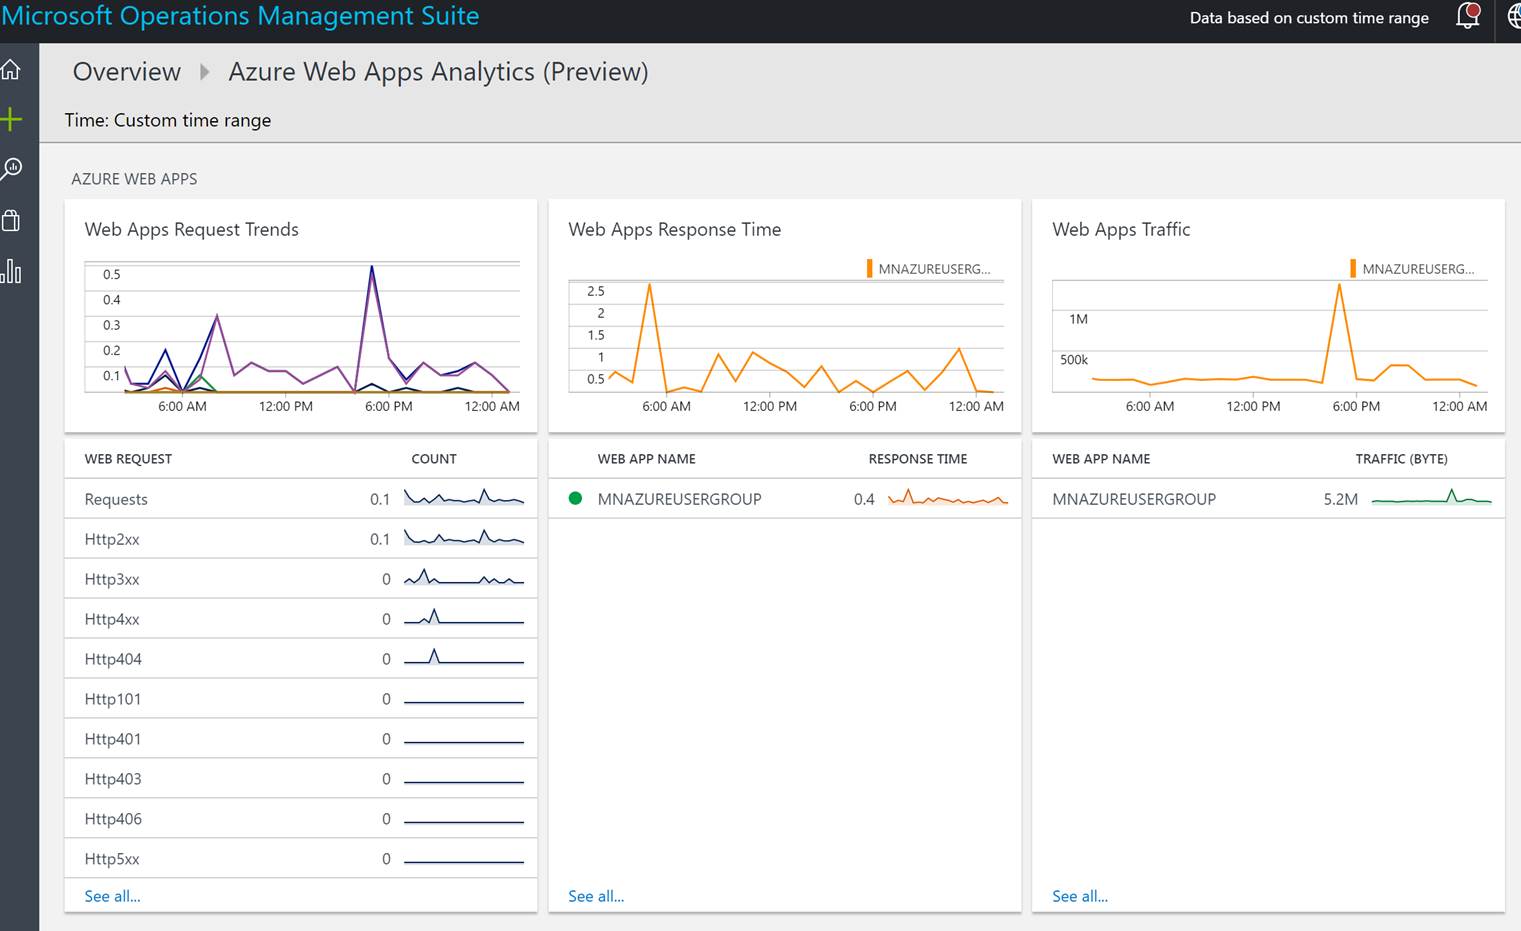
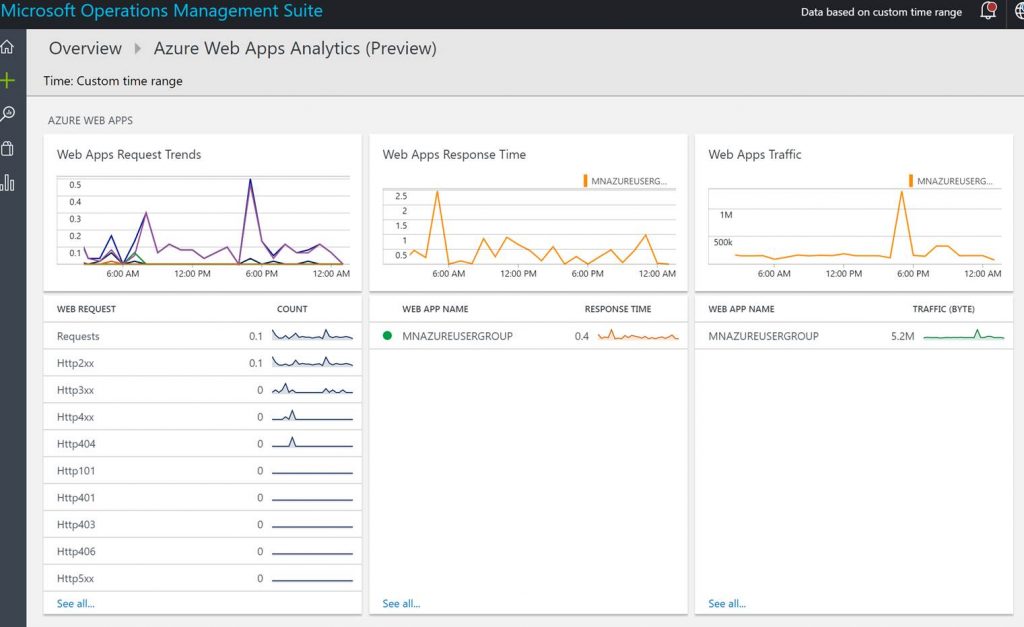
Below is a screenshot of the Azure Web Apps Analytics OMS solution used to gain insight into an Azure web app/s.
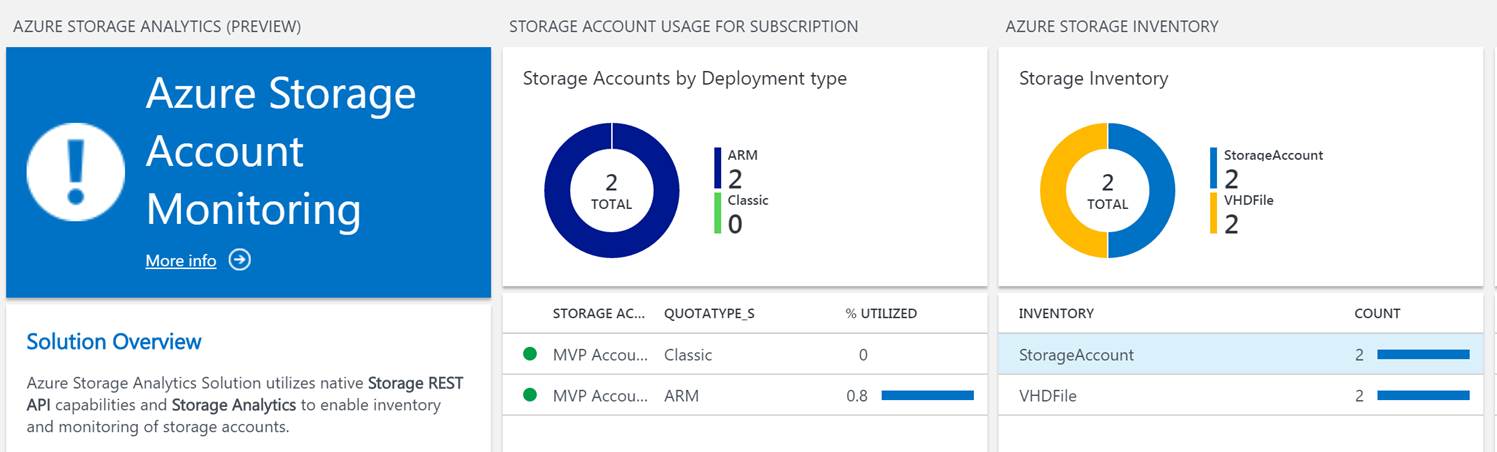
Below is a screenshot of Azure Storage Analytics OMS solution from the Azure Marketplace used to monitor and gain insight into Azure storage.

OMS example use case for monitoring Azure PaaS:
- Front end application can sometimes connect to a SQL database; and sometimes it cannot. Suspected cause is SQL timeout.
- Utilize the Azure SQL Analytics to drill-down into SQL timeouts that have occurred on databases.
Azure Monitor provides a consolidated place for monitoring data from Azure services and base-level infrastructure metrics/logs from Azure services. It is typically used to track performance, security, and identify trends on Azure services. Azure Monitor brings (OMS) log analytics, application insights, and even network watcher into one place. Azure Monitor is still a relatively new service in Azure and it is still taking shape. Azure Monitor does offer some data that (Application Insights and OMS do not). The data you cannot get in OMS and Application Insights includes the history of Azure service issues, planned maintenance, health advisories, health history, and Azure activity logs.
An example use case for using Azure Monitor to help monitor Azure PaaS is:
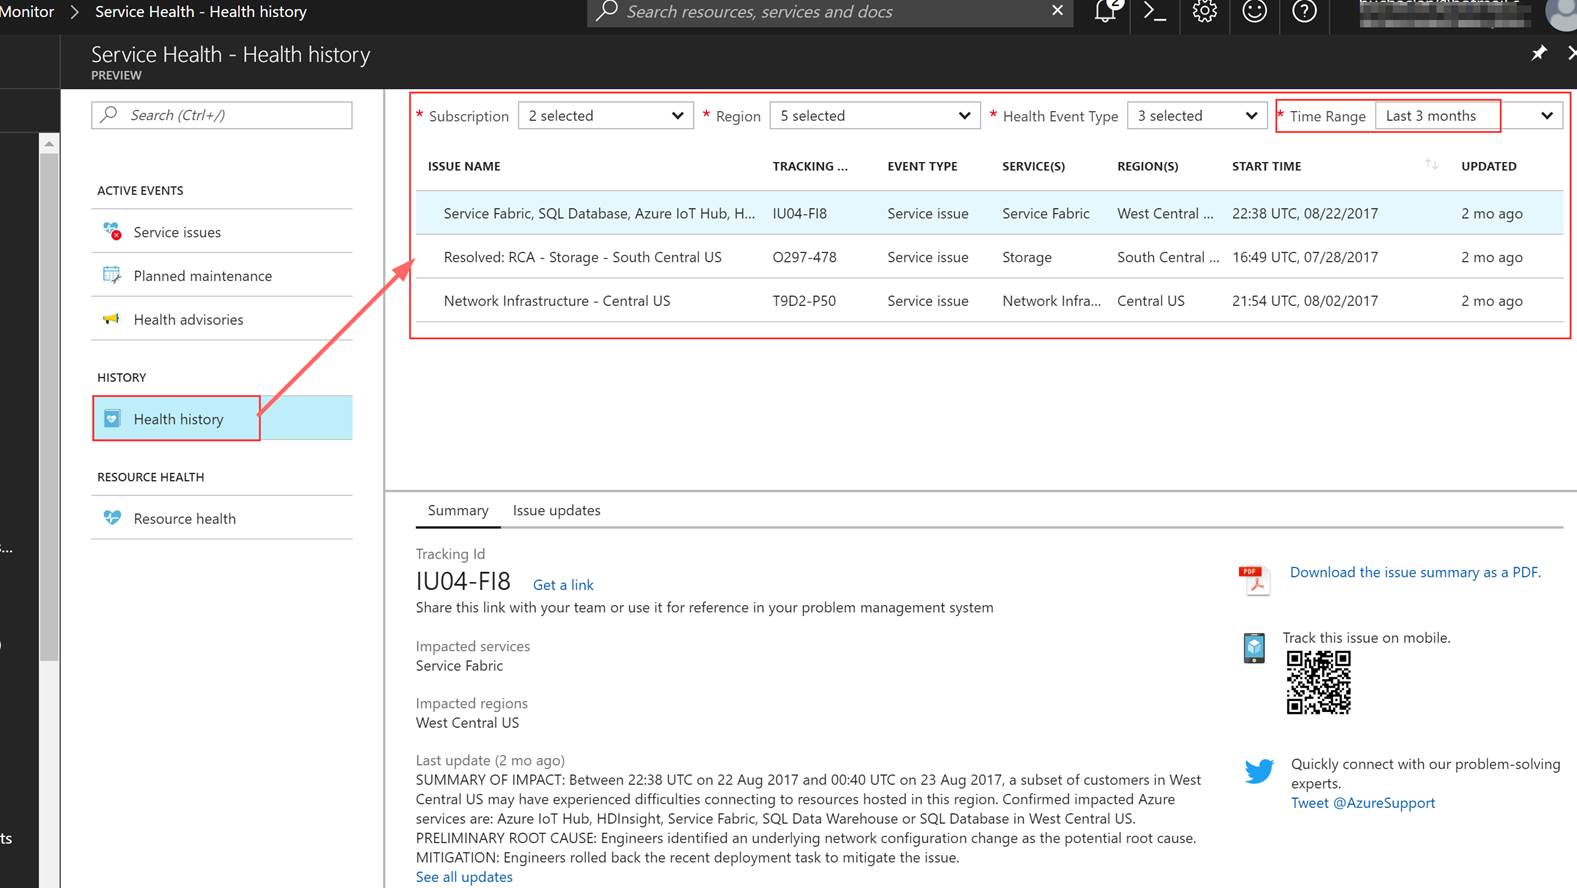
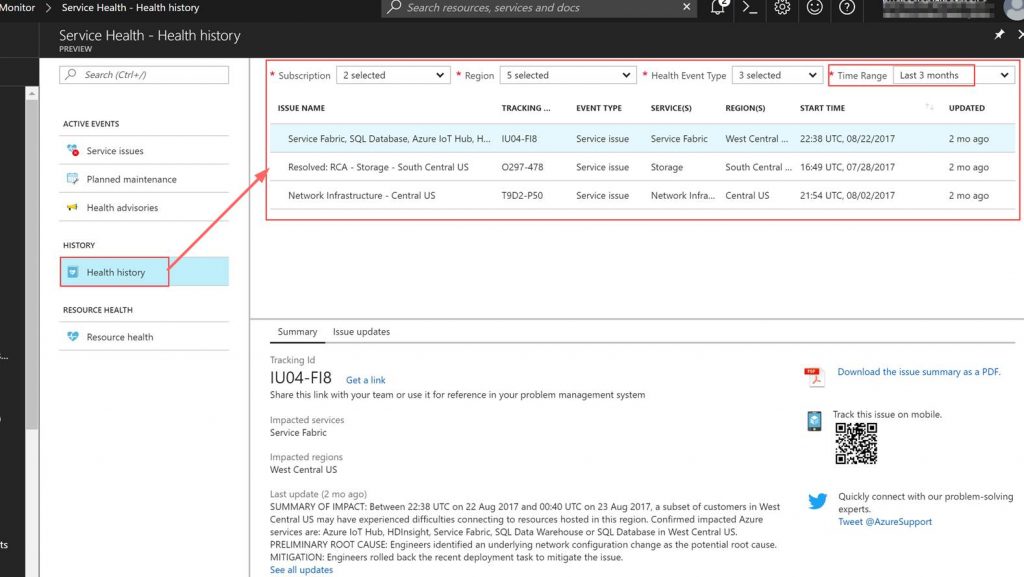
- Need a report of all services issues for a specific region for the past 3 months.
- Utilize health history in Azure Monitor to pull a list of all service issues for a specific region from the past 3 months. This example can be seen in the following screenshot.
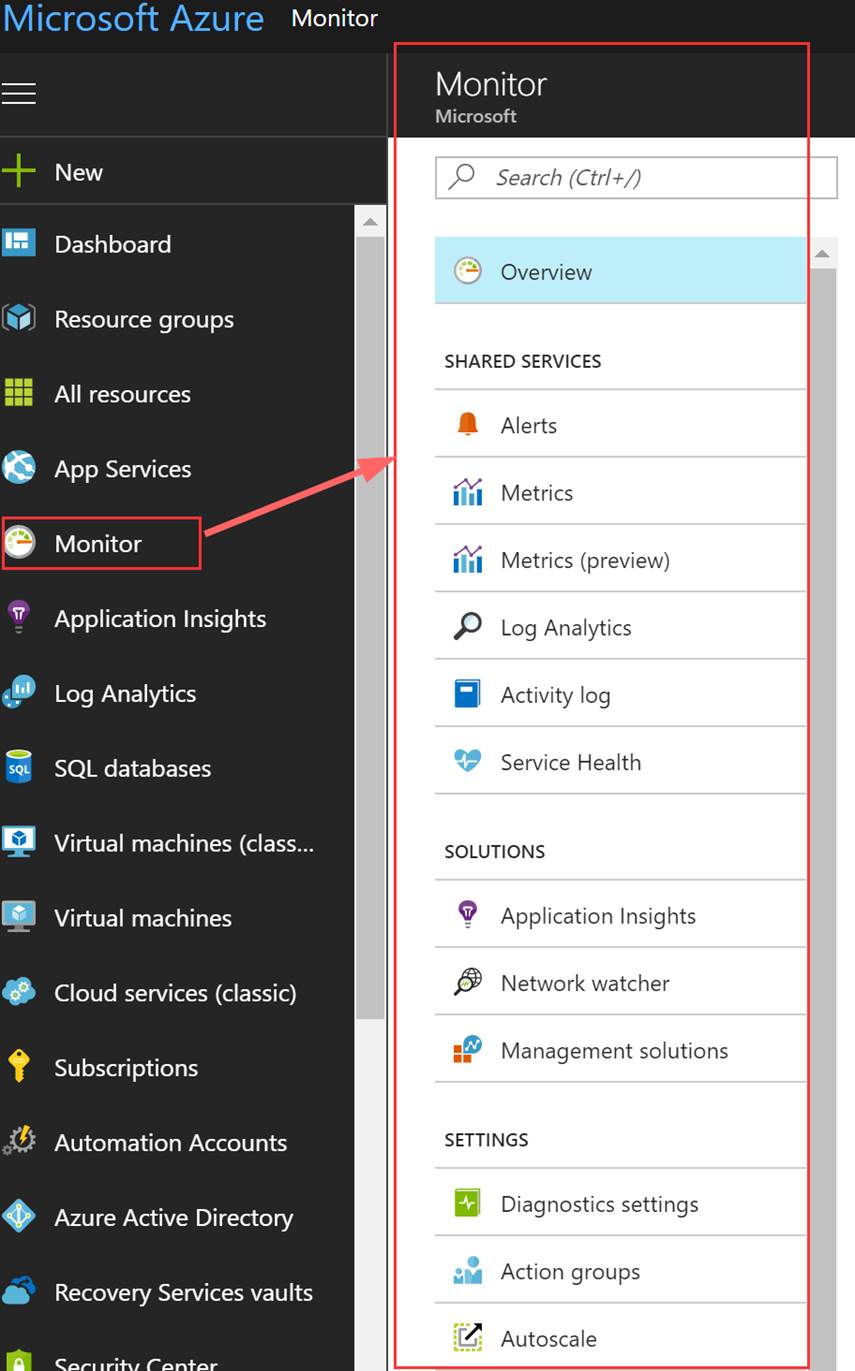
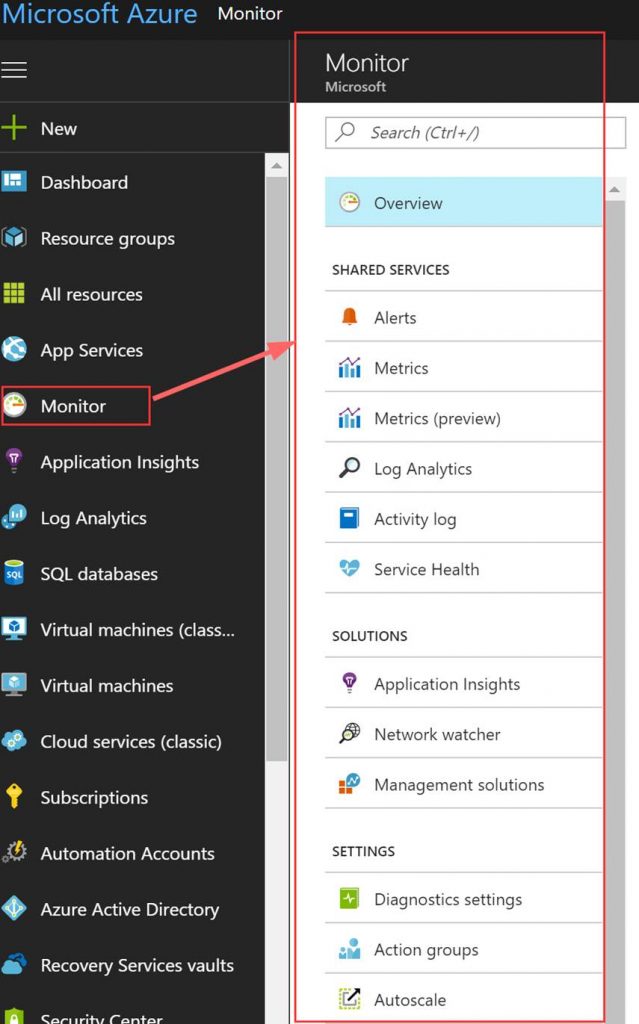
The following screenshot shows the following areas in Azure Monitor that have important Azure monitoring data.
Azure Monitor also has the ability to integrate with many 3rd party solutions that are used by DevOps folks today. The following screenshot is a group of 3rd party integrations that are available for Azure Monitor.
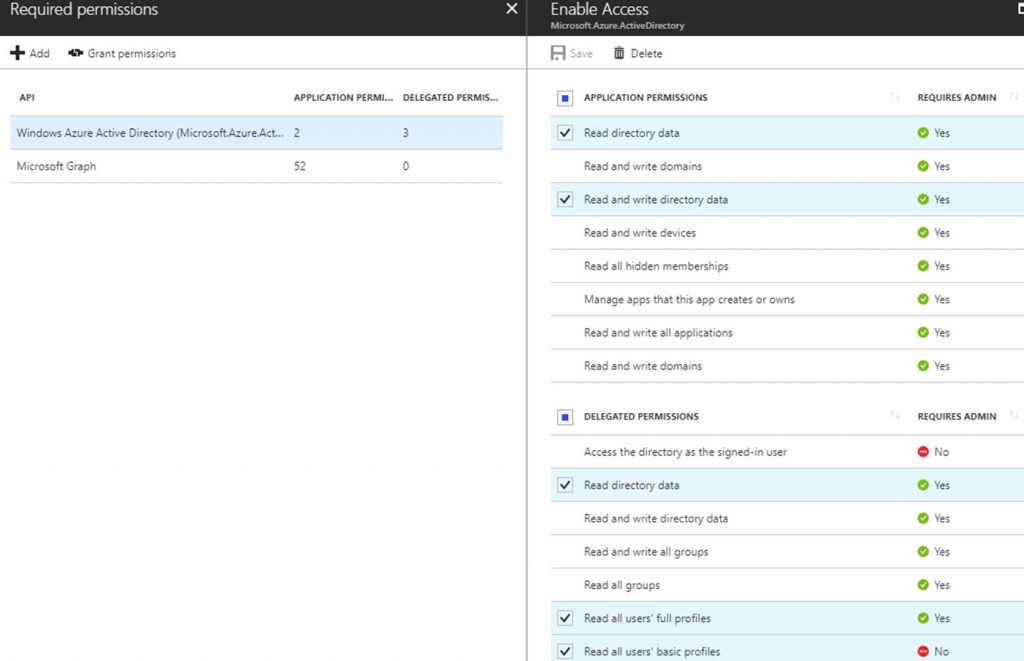
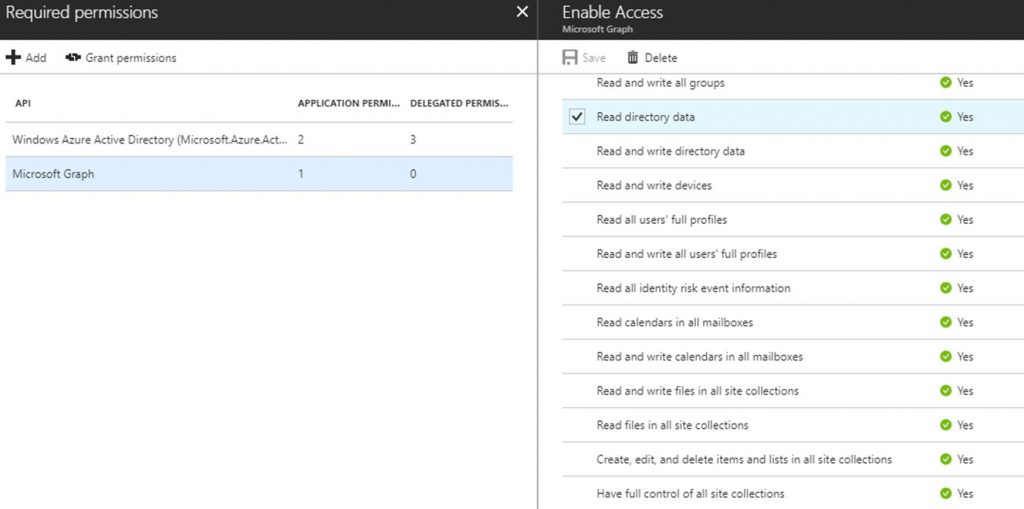
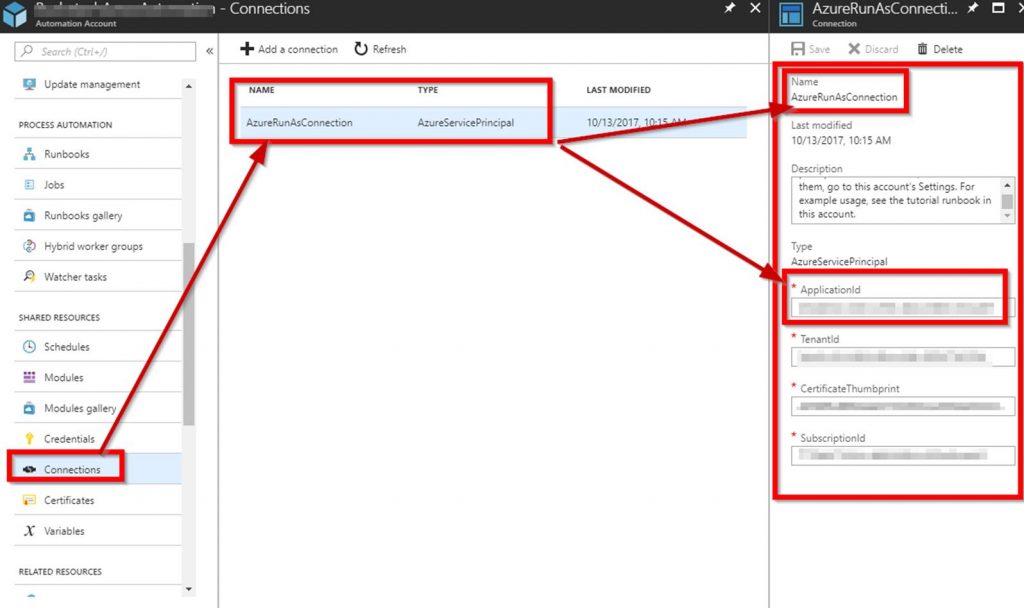
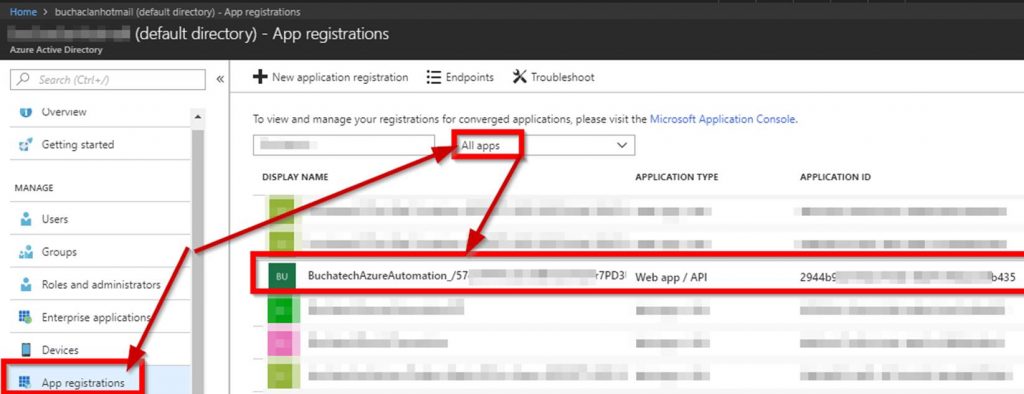
SCOM can be utilized if you want to monitor Azure resources from on-premises you can utilize SCOM for this. There is a management for Azure. There also is a SCOM management pack for Azure Stack. The SCOM management pack for Azure Stack is used to monitor Azure Stack’s fabric. In order to monitor Azure Stack’s IaaS and PaaS you would use the Azure management pack pointing it to your Azure Stack enviroment. The Azure management pack can monitor the availability and performance of Azure resources that are running on Microsoft Azure via Azure REST APIs.
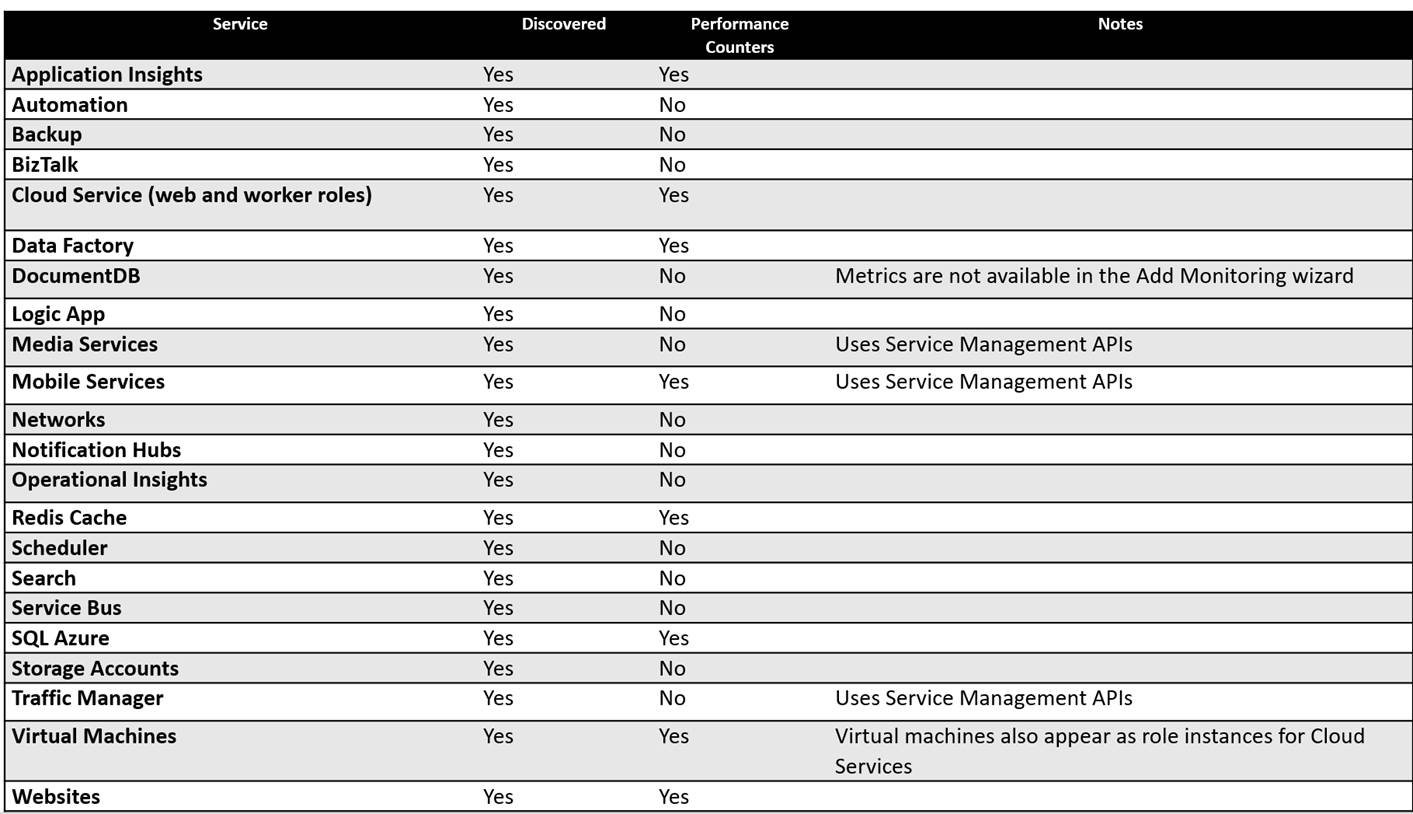
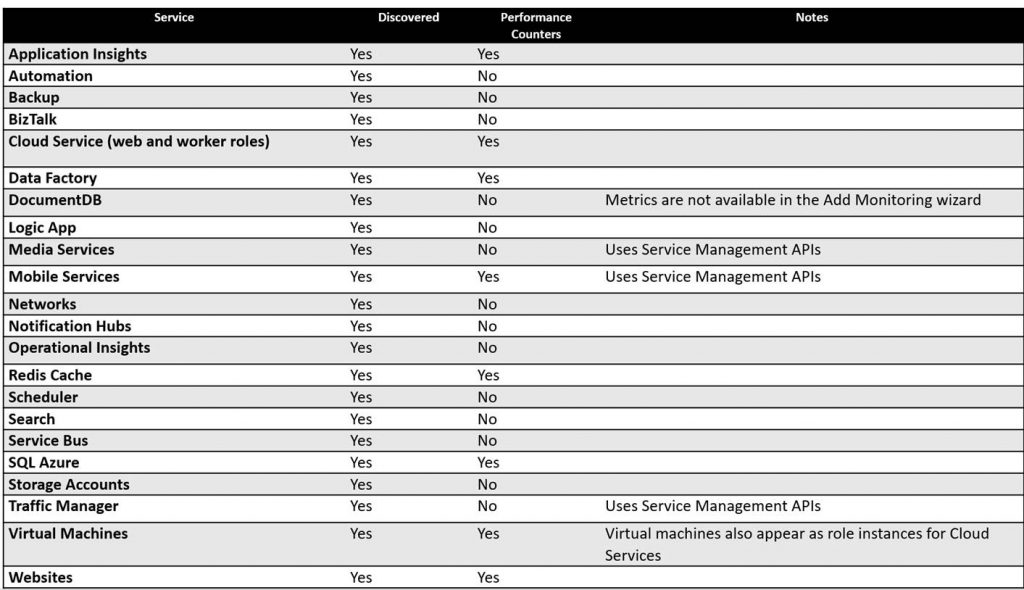
Azure services that can be discovered and monitored with the Azure SCOM management pack.
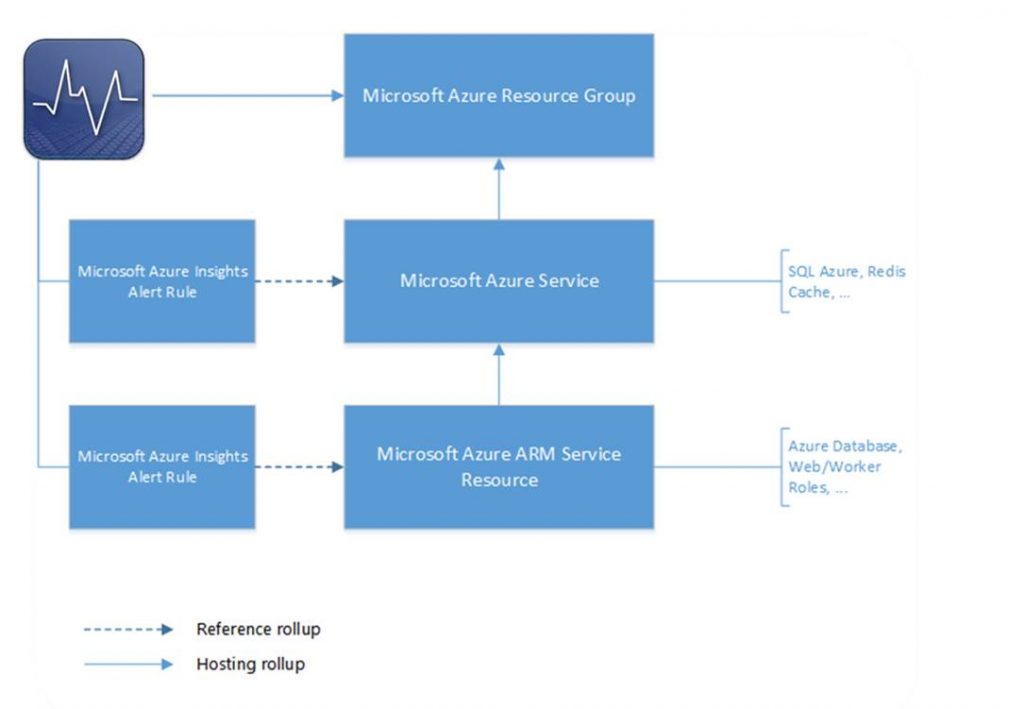
Below is a diagram of how the health rolls up in the Azure SCOM management pack.
Where to get the Azure Management Packs
Azure Management Pack:
https://www.microsoft.com/en-us/download/details.aspx?id=50013
Azure Stack Management Pack:
https://www.microsoft.com/en-us/download/details.aspx?id=55184
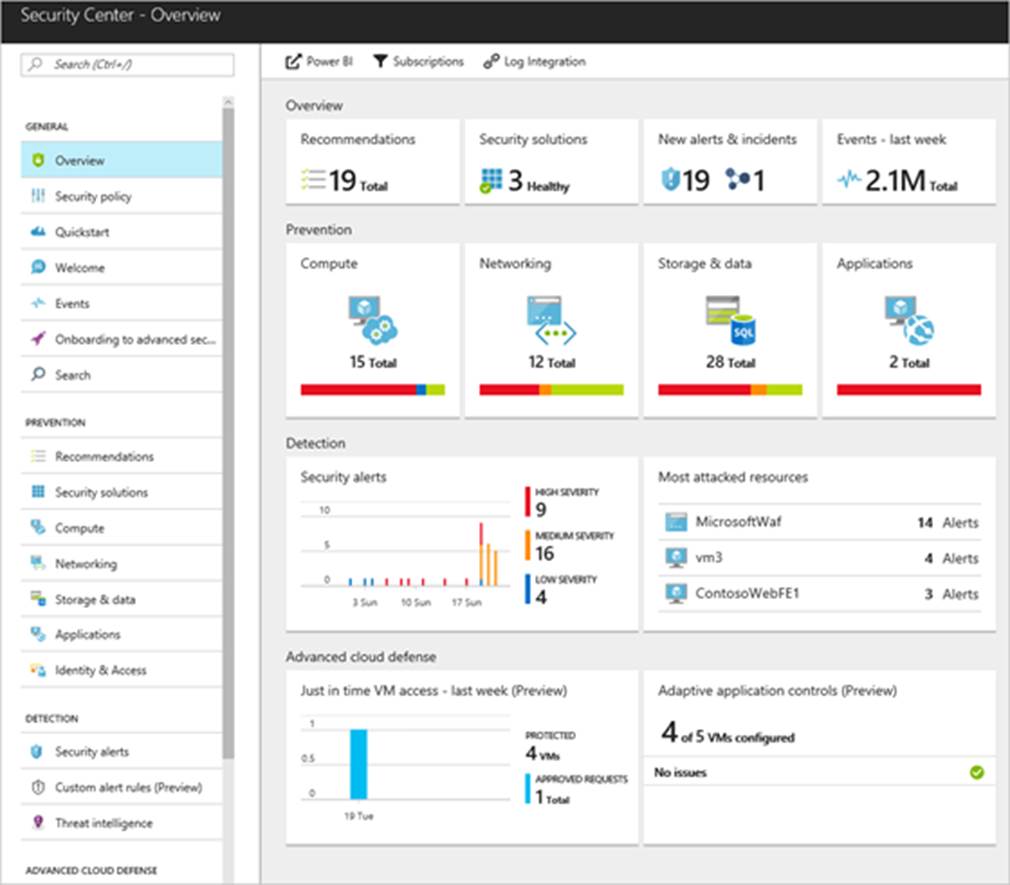
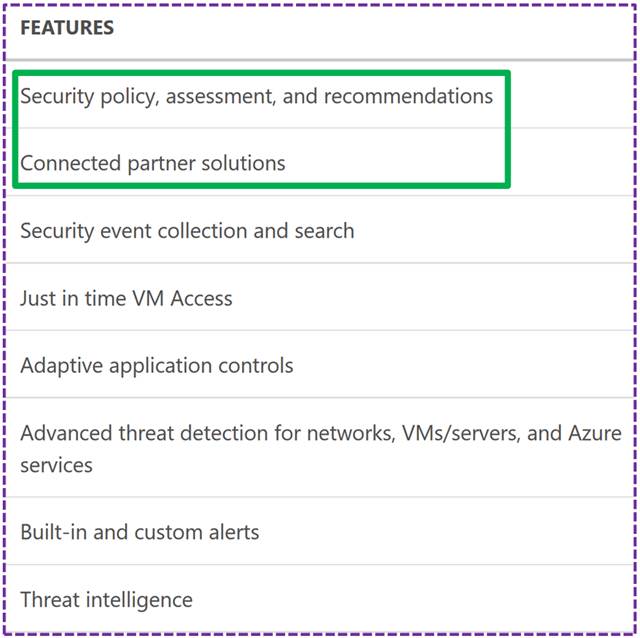
But what about security?
This is where Azure Security Center comes into play. Security Center is a unified security management and advanced threat protection for workloads running in Azure, on-premises, and in other clouds.
Thanks for reading and stay tuned for more blogs on Azure and Azure Stack.
Read more