Azure Policy

A key component of cloud governance in Azure is being able to apply policies across cloud resources. In Azure, there is a  service called Azure Policy that can be used to define policies and enforce them across your cloud resources. Azure Policy can be used to create, assign and, manage, and apply policy definitions. Azure Policy can be set to just evaluate when resources are out of compliance or remediate when resources are out of compliance. These two modes are known as audit effect and deny effect.

Azure policies can be applied to Management Groups, subscriptions, or resources.

Azure Policy has been around for a while but recently it has revamped to make it enterprise ready. Azure Policy is in preview but it won’t be long before it will go GA and can be used to help manage your Azure. There is no pricing yet while Policy is in preview.

Azure Policy is not RBAC. RBAC deals with user access and user actions such as what users can access what resources and what they can do with them. Azure Policy deals with existing resources and resource properties during the deployment of them.

In Azure Policy you have something known as definitions. Definitions are essentially compliance rules that can be assigned to Azure resources. These definitions can just check to see if items are compliant or not and can enforce compliance. Definitions can be used to set conventions for resources, for example, all resources in a subscription should have a certain tag when created. Definitions are also used to evaluate something and take an action based on the result of the evaluation. A good example of this is that you could use a policy definition to evaluate if virtual machines are using managed disks or not. Azure Policies are used to help control costs and manage resources across your Azure subscriptions.

There are two types of definitions called Policy and Initiative. A Policy definition is a single definition. An Initiative definition is a group of Policy definitions. Initiative definitions are used to help achieve larger compliance need. To gain a better understanding of Initiative definitions you can look at Security Center as it leverages Initiative definitions. Security Center has a built-in Initiative definition named [Preview]: Enable Monitoring in Azure Security Center. This built-in Initiative definition for Security Center contains 13 Policy definitions related to security as shown in the following screenshot.

In Azure policy there are built-in and custom definitions. The built-in definitions have been created by Microsoft and are ready to be used to help with common needs in cloud. There are 36 built-in policy definitions today. Custom definitions are built by you. All Azure policies are JSON so writing custom polices is similar to writing ARM templates. Templates for Azure policies can be found in the Repository for Azure Resource Policy samples here: https://github.com/Azure/azure-policy. You can use these samples as a starting point when building your own. Here is an example of an Azure policies JSON:

Read more

Azure Management Groups

If your company is like most organizations that are using the cloud, then you have many subscriptions floating around. This is often due to “shadow IT”. However, sometimes organizations simply use many subscriptions as a way to put boundaries around cloud services for departments, teams or other reasons.

Microsoft has built a new service in Azure to help with the governance of your cloud. This new service is called Management Groups. Management Groups is still in preview but it is something I highly recommend you start trying out or using now as it is going to be as big for cloud as group policy was for on-premises AD based environments.

Management Groups sit above subscriptions. This allows Management Groups to be at the highest level in the chain so they can be used to effectively manage access, policies, and compliance for any subscriptions that belong to your organization. Within Management Groups you can set access controls (RBAC) and Azure policy to be applied to subscriptions. Subscriptions are organized in logical containers and the containers are the “management groups”. Your governance conditions are then applied to the management groups. This is the much-needed enterprise level type of management that has been needed in Azure for a while.

Management Groups will eventually become the starting point of governance when organizations embark on the cloud. Management Groups also can be used for organizations that are already in the cloud. I am going to dive into Management Groups giving you a high-level tour but first I need to give some more background on the components of Management Groups.

Each directory has a “root management group”. This root management group is at the top level of the management group hierarchy. All other management groups and subscriptions fold up to the root management group. Access and policies can be applied at the directory level via this root management group.

A couple of other things to note about management groups are that you can only have up to 10,000 management groups in a single directory, a management group tree can go six levels deep not including the root management group, and each management group can have multiple children management groups but only one parent management group.

Now let’s explore how I have structured my management groups to give some examples of how this works. Note that all the examples I show in this blog post are for my Azure environments but yours will be different based on many factors such as your organizational structure of departments, teams, etc.

You can find management groups under All Services>>Management Groups.

When you first access Management Groups you will need to create a root MG. Note that the root MG cant deleted or moved. You can rename the root MG. In the following screenshot, I am showing the creation of a sub MG in my root MG. Also, notice on the left-hand side you can set Access controls (RBAC) on this MG.

In order to configure Azure Policies and apply it to a management group, you do that within the Azure Policy itself. You can see in the following screenshot that I have an Azure policy and I am scoping it to the Prod01 MG. Whatever subscription/s and resources in those subscriptions will inherit the policy unless an exclusion is set in the policy or I am breaking inheritance at the resource group level.

In the following screenshot, I am showing the addition of an existing resource. The resources you can add are other MG’s or subscriptions.

In the following screenshot, you can see that I am going to add one of my subscriptions to my Dev01 management group. After doing this I can configure development related access and development related policies to this subscription. I also can do the same thing with my production environments/subscriptions.

Here is what my Management Groups hierarchy looks like:

In my hierarchy I have 3 subscriptions I split into two for production and 1 for development. I have created a root management group and placed all other management groups in it. I created a parent management group for my prod subscriptions and 1 for my development subscriptions in case I add more in the future. I then created a prod01 and prod02 pulling a subscription into each one. Doing this allows me to have separate access and policies per subscription. One thing you could do is pull multiple subscriptions into a single management group.

Note that I also could apply access and policies at the root level or at one of my environment management groups i.e. Prod_Env/Dev_Env and the sub-management groups would inherit the access and policies that are set at the environment management group level.

Also if you need to you can move management groups to a new parent management groups.

Thanks for reading this post. As I mentioned at the beginning of this post Azure Management Groups are currently in preview but they are worth checking out and potentially using now as these are going to become a critical part of the Azure governance story.

Read more

Azure Mobile App

Microsoft has a mobile Azure mobile app for Android and IOS. At first I was skeptical about the need of a mobile app for cloud but I found myself actually using it a few times for various tasks that I did not want to log onto my computer to do. In this blog post I am going to give one example. Before I jump into the example let’s explore the app.

First off you can load the app from Itunes or Google Play. You also can check it out here: https://azure.microsoft.com/en-us/features/azure-portal/mobile-app/ and here: https://play.google.com/store/apps/details?id=com.microsoft.azure&hl=en.

With the app in general you can see your Azure resources, their metrics, their health along with alerts, and diagnose and fix some issues through some actions you can perform on the resources via the mobile app. Some of the actions you can perform are Restart a web app or connect to a VM. Something else you can do with the app is access the Azure cloud shell. It supports Bash and PowerShell.  The following are some screenshots from the app.

Here is the app on my Android:

After the app launches for the first time you will be prompted to log into your subscription. Once you are logged in you will see all of your resources.

You can actually click on the filter icon to scope down to a specific type of resources.

The last screenshot here is of the Azure cloud shell in the mobile app.

Now lets talk about one reason you may use the app. I host an Azure user group website on WordPress on Azure. I have an availability monitor in Application Insights monitoring the site. If the site goes down I get an email from Application Insights as shown in the following screenshot.

I also get a notification in the UG board Slack channel by Logic Apps if the site is down. Well one day I got the notification from Slack on my phone.

I was not at my computer and did not want to go to it just to see what was going on with the site. I checked and sure enough the site was down.

Instead of logging onto my computer to troubleshoot I just used the app on my phone. Logging in I was able to see the site was up.

After clicking on the web app I was able to quickly restart it. It was up after that and I did it all from my phone.

I know restarting a web app is a basic thing. It saves time not having to log all the way into a computer to do this. I recommend trying out the mobile app. You never know when it might come in handy for a quick way to get info about one of your Azure resources and even help you troubleshoot something.

Read more

Setup CI/CD pipeline with VSTS & Azure Stack

We all know that DevOps brings together people, processes, and technology. In the Microsoft DevOps world A large part of the technology piece is utilizing Visual Studio Team Services (VSTS) for continuous deployment of workloads to Azure.

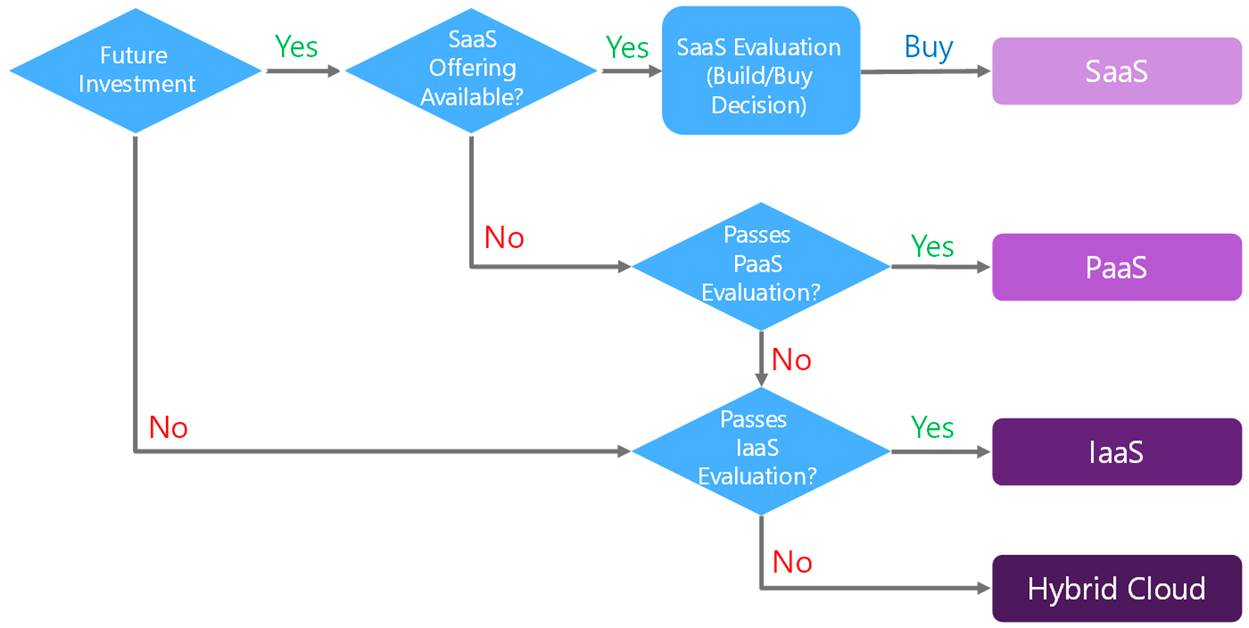
Microsoft launched their Hybrid Cloud on July 10th 2017. Azure Stack is the secret sauce of Microsoft’s the Hybrid Cloud. Microsoft’s offering is the only one true Hybrid Cloud in the market bringing Azure to on-premises data centers.

As Microsoft continues to move their Hybrid Cloud forward the DevOps integration and capabilities we have for Azure extend to Azure Stack. Again I was fortunate to participate in a preview of the VSTS integration with Azure Stack. I was happy to see Microsoft putting a priority on this functionality because DevOps on Azure Stack is a HUGE need. Cloud is often the catalyst to helping organizations adopt a DevOps culture fostering digital transformation. Some organizations not being able to put all workloads in public cloud Azure Stack is a good way for them to get the same cloud capabilities on-premises DevOps integration being one of them. The setup and integration between VSTS and Azure Stack is working nicely. The team at Microsoft has given me permission to share about this topic via my blog.

In this blog post I am going to cover setting up VSTS to work with Azure and setting up a continuous-integration and-continuous deployment (CI/CD) pipeline to Azure Stack. With Microsoft DevOps you can utilize the pieces of VSTS that make sense for you to use leaving the control up to you. Through VSTS you can use many other DevOps tools such as Jenkins, Octopus deploy, GitHub, Bitbucket etc into your pipeline making Azure Stack just as flexible as Azure is. Let’s Jump in!

Steps to prep Azure Stack for Visual Studio Team Services (VSTS)

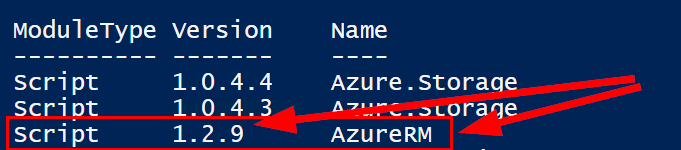
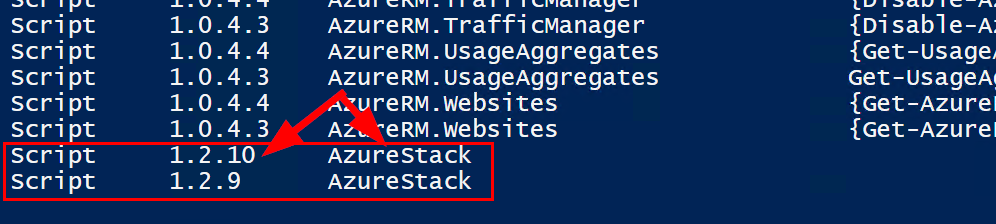
#1 Ensure you have installed the Azure Stack PowerShell and Azure PowerShell modules.

Details can be found here:

https://docs.microsoft.com/en-us/azure/azure-stack/azure-stack-powershell-install

#2 Add the Azure Stack environment using the following syntax

# Navigate to the downloaded folder and import the **Connect** PowerShell module

Set-ExecutionPolicy RemoteSigned

Import-Module PATH\AzureStack.Connect.psm1

# Register an AzureRM environment that targets your Azure Stack instance

Add-AzureRMEnvironment `

-Name “AzureStackAdmin” `

-ArmEndpoint “https://adminmanagement.local.azurestack.external

# Set the GraphEndpointResourceId value

Set-AzureRmEnvironment `

-Name “AzureStackAdmin” `

-GraphAudience “https://graph.windows.net/

# Get the Active Directory tenantId that is used to deploy Azure Stack

$TenantID = Get-AzsDirectoryTenantId `

-AADTenantName “YOURDOMAIN.onmicrosoft.com” `

-EnvironmentName “AzureStackAdmin”

# Sign in to your environment

Login-AzureRmAccount `

-EnvironmentName “AzureStackAdmin” `

-TenantId $TenantID

NOTE: You will need the environment name and the tenant ID for the next script.

#3 Create SPN

Original SPN creation script can be found here:

https://github.com/Microsoft/vsts-rm-documentation/blob/master/Azure/SPNCreation.ps1

Documentation on creating an SPN can be found here:

https://www.visualstudio.com/en-us/docs/build/concepts/library/service-endpoints#sep-azure-rm

Below I will display the script I used. Note that you will need the following parameters for the script:

$subscriptionName

“Enter Azure Stack Subscription name. You need to be Subscription Admin to execute the script”)]

$password

“Provide a password for SPN application that you would create”

$environmentName

“Provide Azure Stack environment name for your subscription”

$AzureStackTenantID

“Provide tenant ID from when Azure Stack enviroment was added”

EXAMPLE:

.\CreateSPN.ps1 -subscriptionName “Default Provider Subscription” -password PASSWORDHERE -environmentName AzureStackAdmin -AzureStackTenantID ID HERE

Here is the script I used that you can run:

param

(

[Parameter(Mandatory=$true, HelpMessage=”Enter Azure Stack Subscription name. You need to be Subscription Admin to execute the script”)]

[string] $subscriptionName,

[Parameter(Mandatory=$true, HelpMessage=”Provide a password for SPN application that you would create”)]

[string] $password,

[Parameter(Mandatory=$false, HelpMessage=”Provide a SPN role assignment”)]

[string] $spnRole = “owner”,

[Parameter(Mandatory=$false, HelpMessage=”Provide Azure Stack environment name for your subscription”)]

[string] $environmentName,

[Parameter(Mandatory=$false, HelpMessage=”Provide tenant ID from when Azure Stack enviroment was added”)]

[string] $AzureStackTenantID

)

#Initialize

$ErrorActionPreference = “Stop”

$VerbosePreference = “SilentlyContinue”

$userName = $env:USERNAME

$newguid = [guid]::NewGuid()

$displayName = [String]::Format(“VSO.{0}.{1}”, $userName, $newguid)

$homePage = “http://” + $displayName

$identifierUri = $homePage

#Initialize subscription

$isAzureModulePresent = Get-Module -Name AzureRM* -ListAvailable

if ([String]::IsNullOrEmpty($isAzureModulePresent) -eq $true)

{

Write-Output “Script requires AzureRM modules to be present. Obtain AzureRM from https://github.com/Azure/azure-powershell/releases. Please refer https://github.com/Microsoft/vsts-tasks/blob/master/Tasks/DeployAzureResourceGroup/README.md for recommended AzureRM versions.” -Verbose

return

}

Import-Module -Name AzureRM.Profile

Write-Output “Provide your credentials to access Azure subscription $subscriptionName” -Verbose

Login-AzureRmAccount -SubscriptionName $subscriptionName -EnvironmentName $environmentName -TenantId $AzureStackTenantID

$azureSubscription = Get-AzureRmSubscription -SubscriptionName $subscriptionName

$connectionName = $azureSubscription.SubscriptionName

$tenantId = $azureSubscription.TenantId

$id = $azureSubscription.SubscriptionId

#Create a new AD Application

Write-Output “Creating a new Application in AAD (App URI – $identifierUri)” -Verbose

$azureAdApplication = New-AzureRmADApplication -DisplayName $displayName -HomePage $homePage -IdentifierUris $identifierUri -Password $password -Verbose

$appId = $azureAdApplication.ApplicationId

Write-Output “Azure AAD Application creation completed successfully (Application Id: $appId)” -Verbose

#Create new SPN

Write-Output “Creating a new SPN” -Verbose

$spn = New-AzureRmADServicePrincipal -ApplicationId $appId

$spnName = $spn.ServicePrincipalName

Write-Output “SPN creation completed successfully (SPN Name: $spnName)” -Verbose

#Assign role to SPN

Write-Output “Waiting for SPN creation to reflect in Directory before Role assignment”

Start-Sleep 20

Write-Output “Assigning role ($spnRole) to SPN App ($appId)” -Verbose

New-AzureRmRoleAssignment -RoleDefinitionName $spnRole -ServicePrincipalName $appId

Write-Output “SPN role assignment completed successfully” -Verbose

#Print the values

Write-Output “`nCopy and Paste below values for Service Connection” -Verbose

Write-Output “***************************************************************************”

Write-Output “Connection Name: $connectionName(SPN)”

Write-Output “Subscription Id: $id”

Write-Output “Subscription Name: $connectionName”

Write-Output “Service Principal Id: $appId”

Write-Output “Service Principal key: <Password that you typed in>”

Write-Output “Tenant Id: $tenantId”

Write-Output “***************************************************************************”

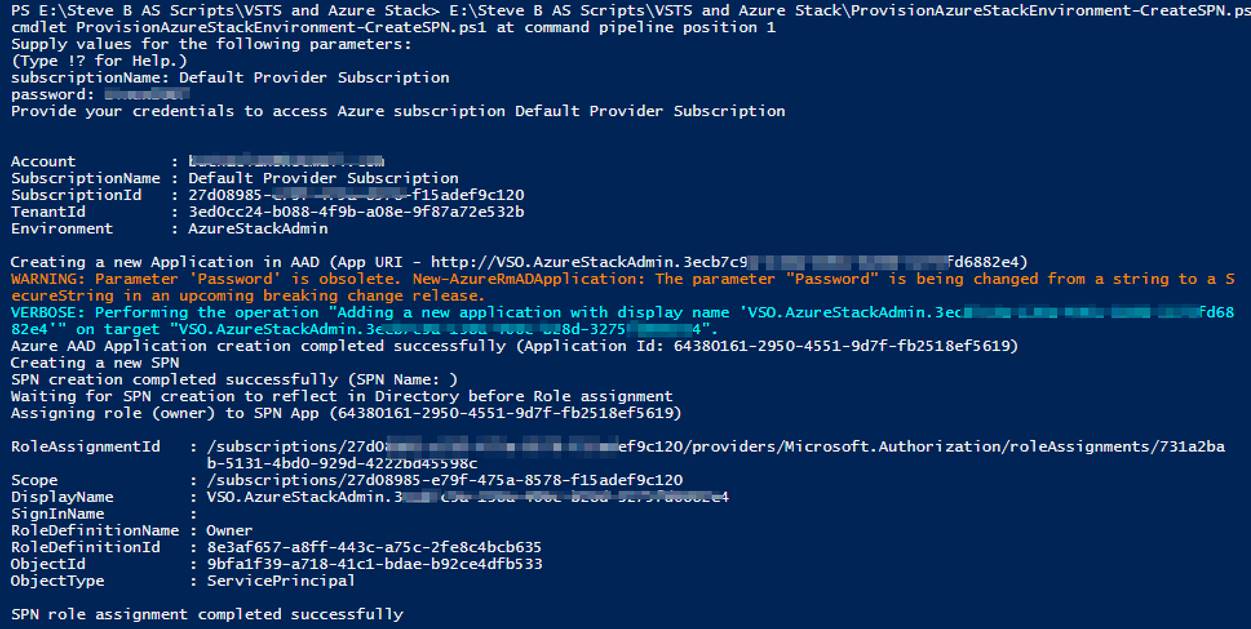
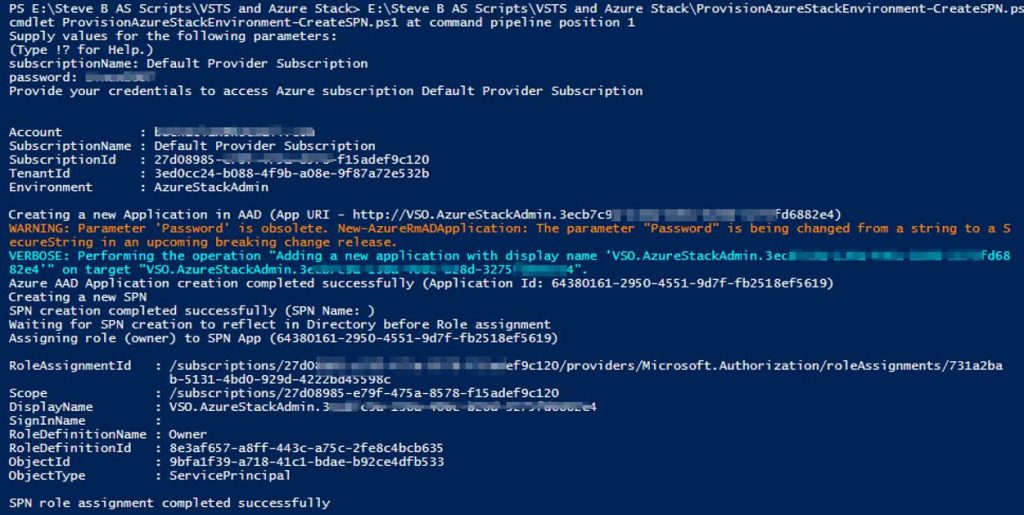
Output should be similar to this:

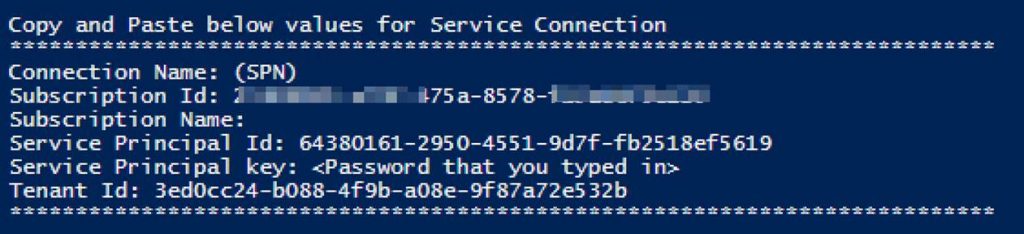
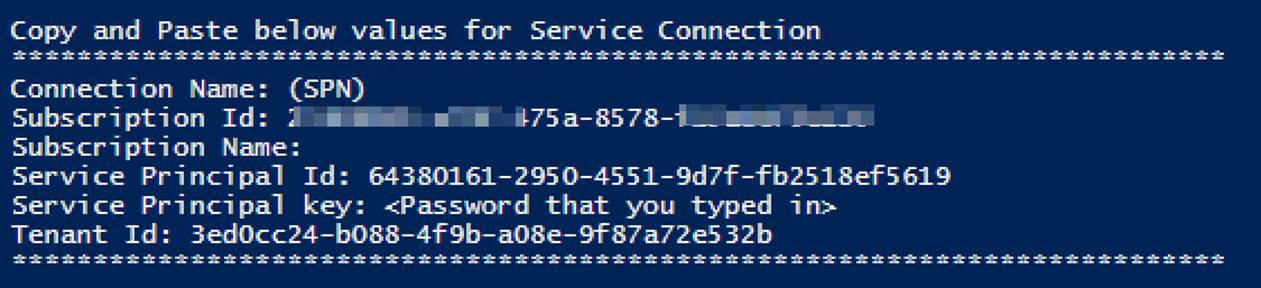
You will use information from the Service Connection output in the next step.

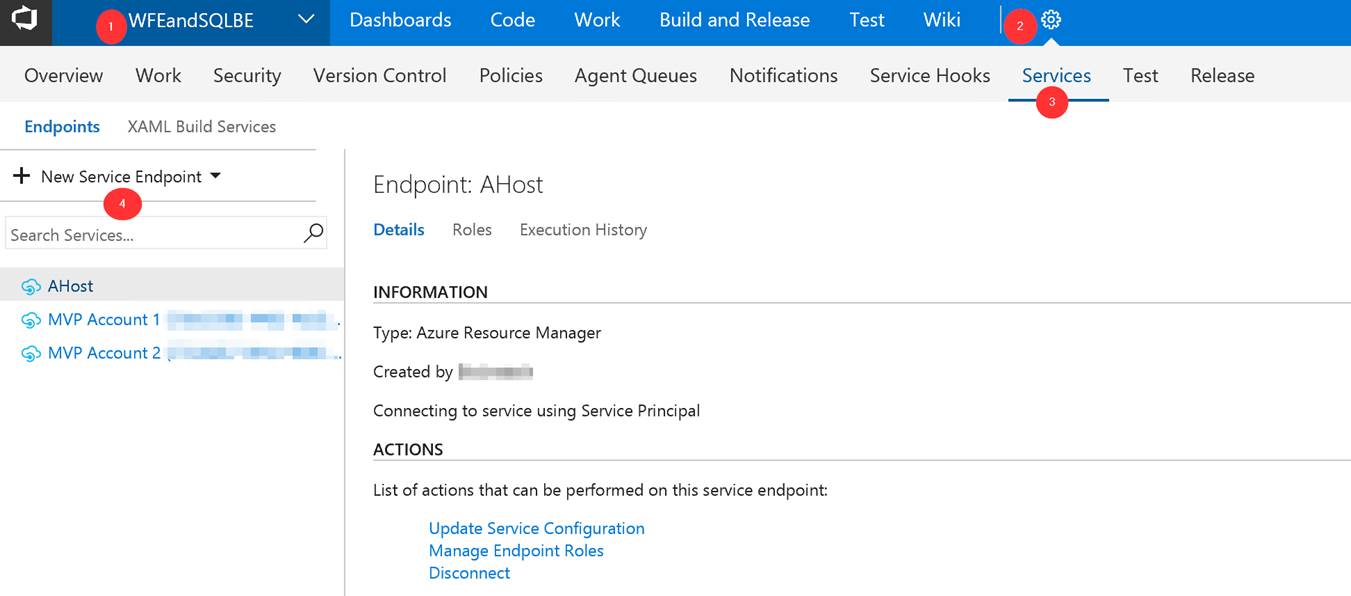
Steps to configure Azure Stack as a Service Endpoint in VSTS

Log into your VSTS account at visalstudio.com

Navigate to one of your projects.

Go into Settings.

Click on Services.

Click on New Service Endpoint

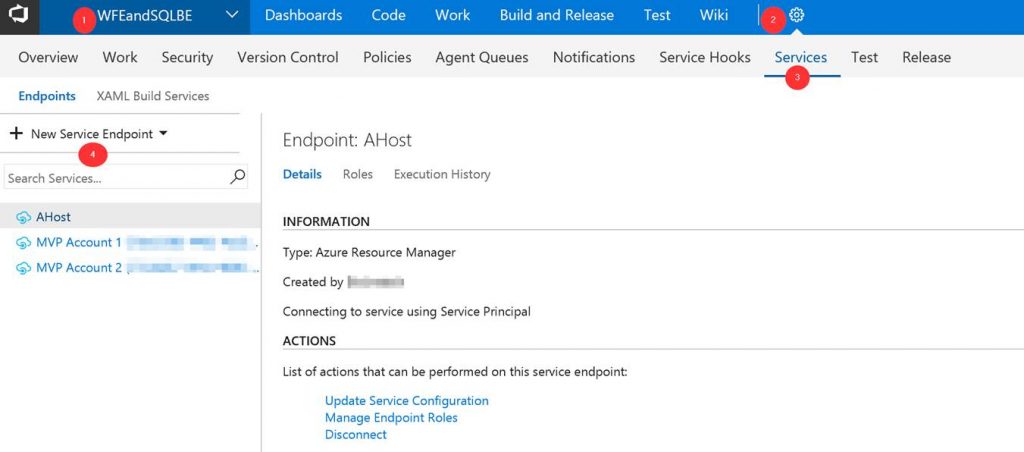
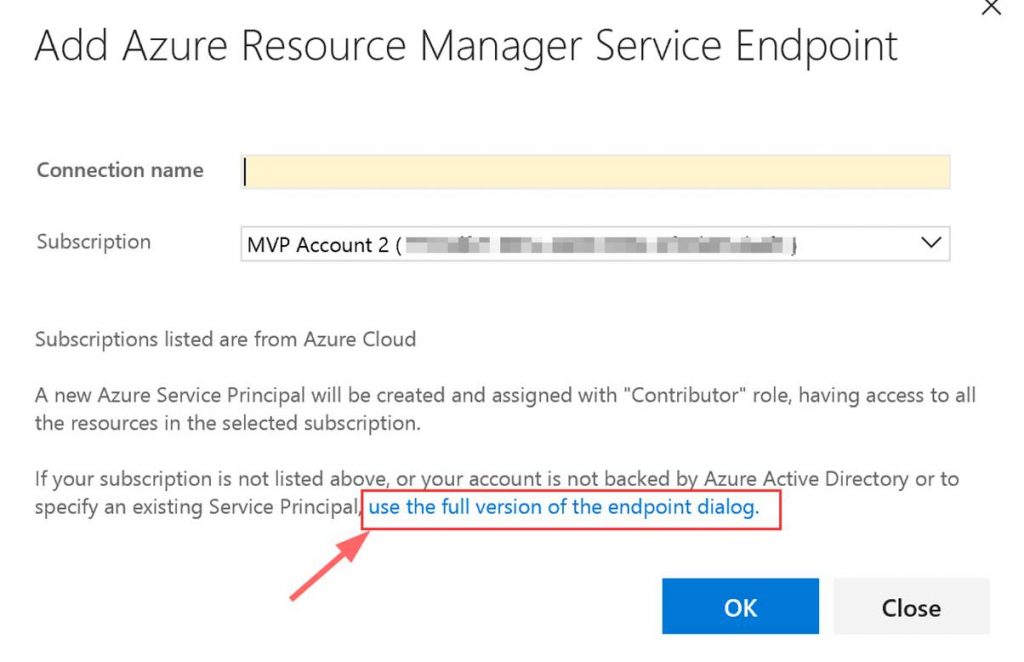
A window will pop up. Click on “use full version of the endpoint dialog.”

Next input the needed data. This data comes from the Service Connection info that you copied.

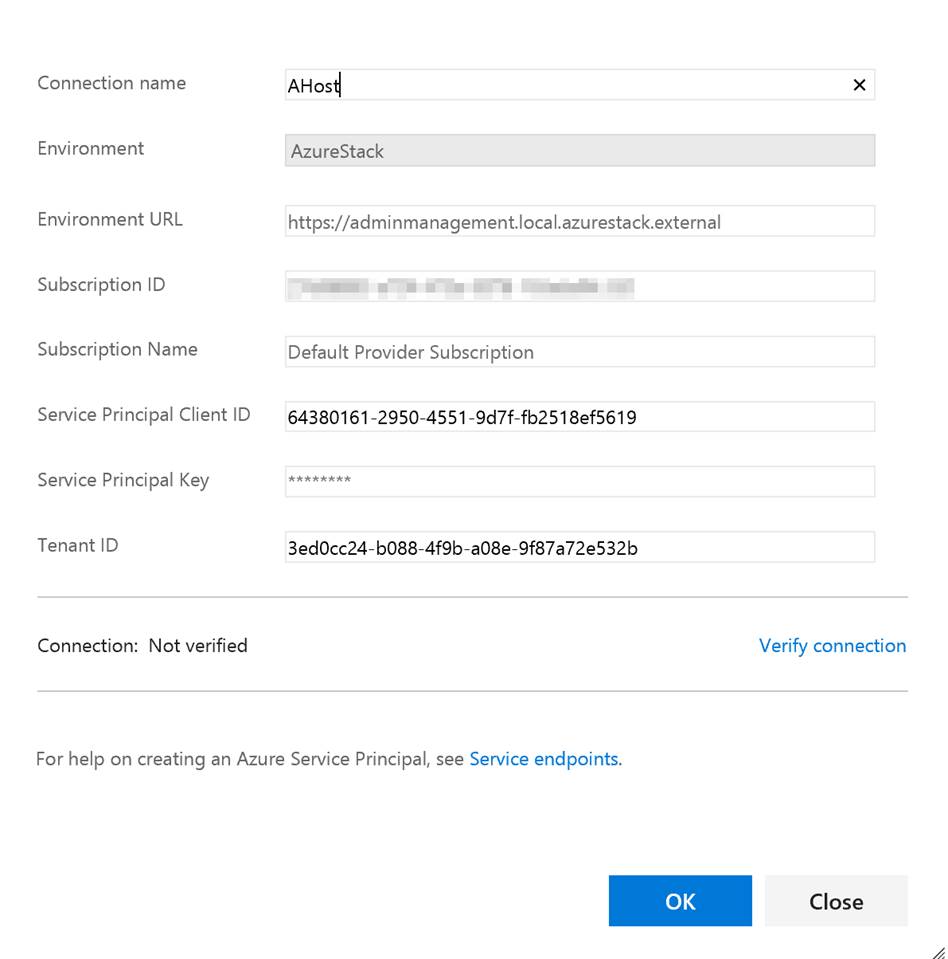
You can put whatever you want in the Connection name and the Subscription Name. Note do not verify the connection. It will not succeed as VSTS cannot access your private Azure Stack yet. Click OK when done.

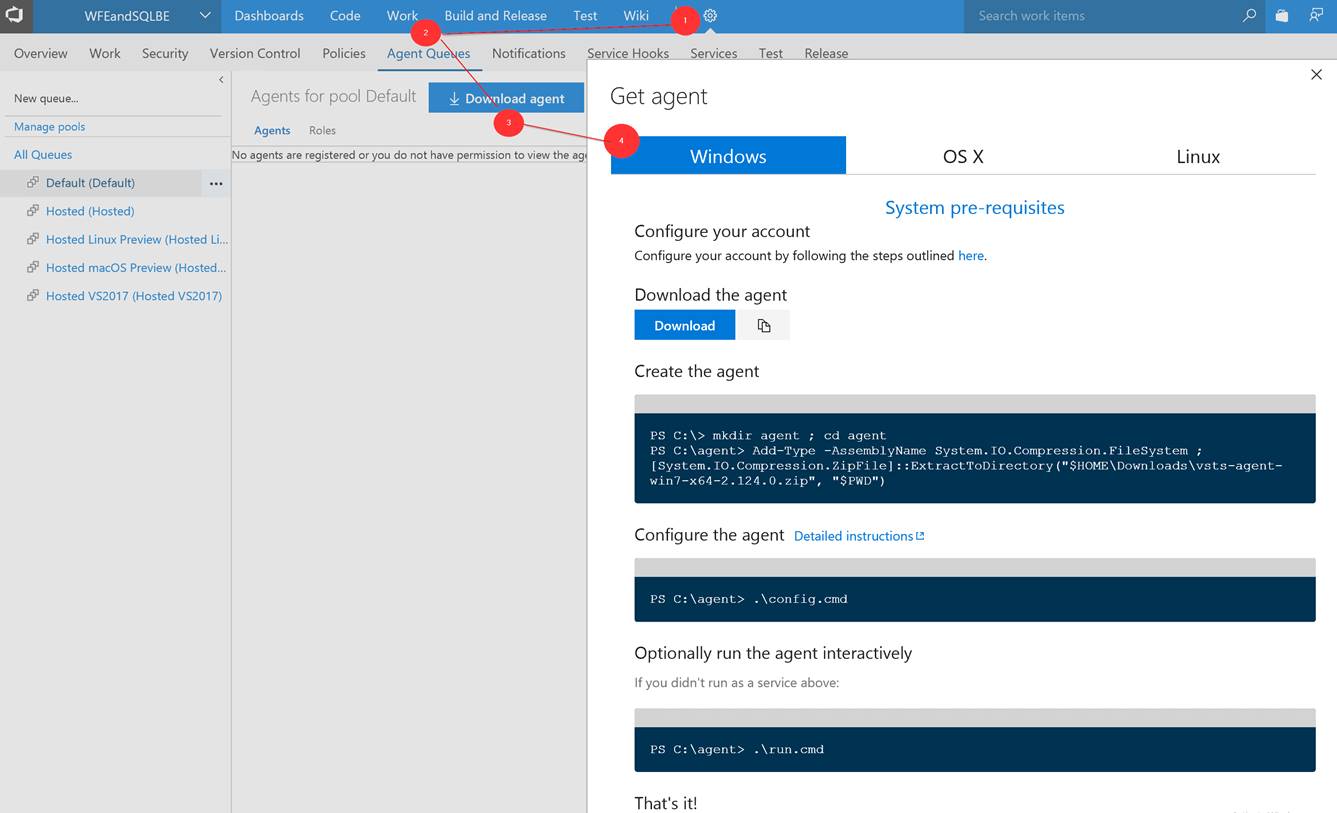
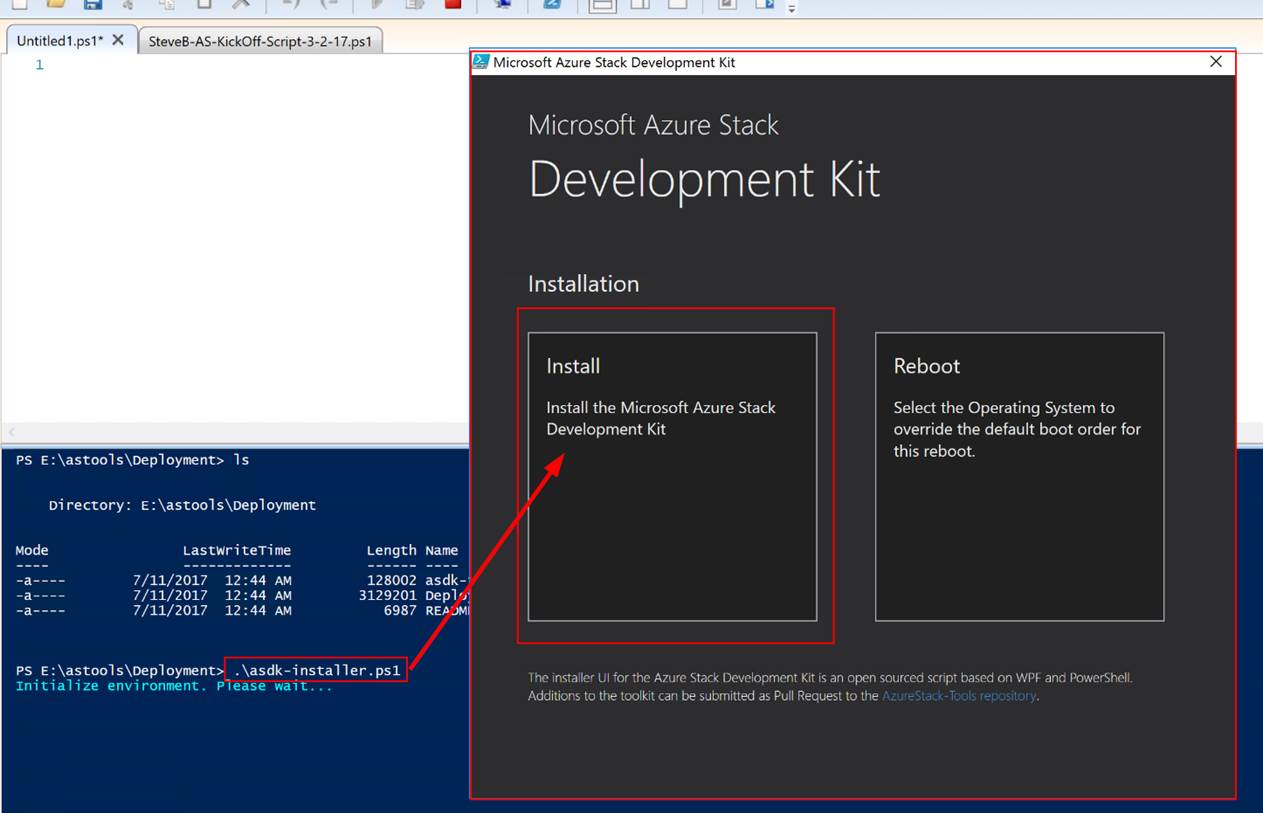
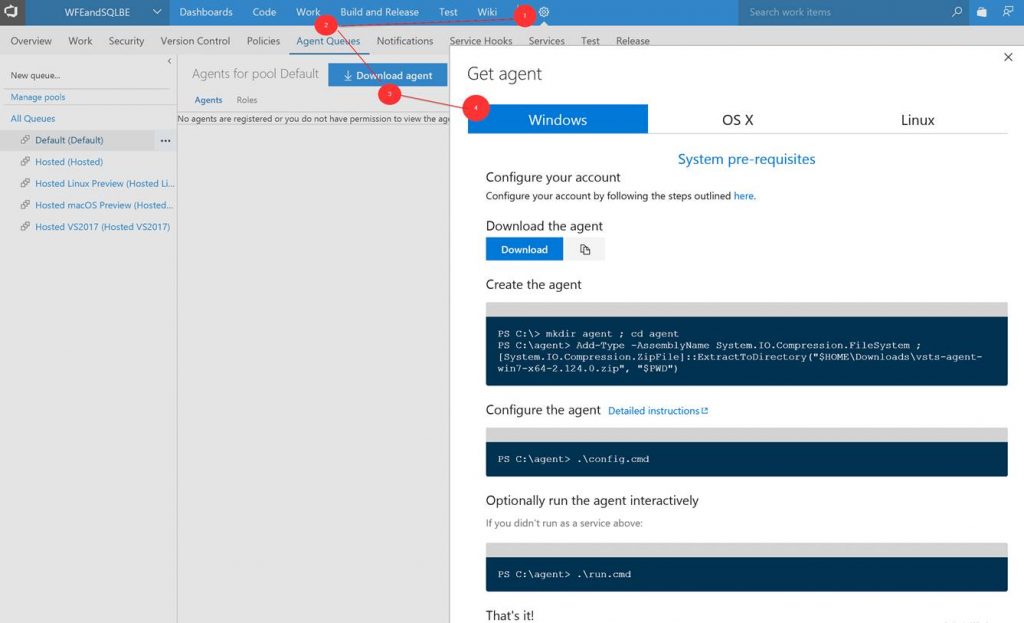
Setup build agent on Azure Stack host

Next you need to setup the build agent on the Azure Stack host. (Note: In this post I am using the ASDK.) From within VSTS download the Windows agent. Extract the download to a local folder.

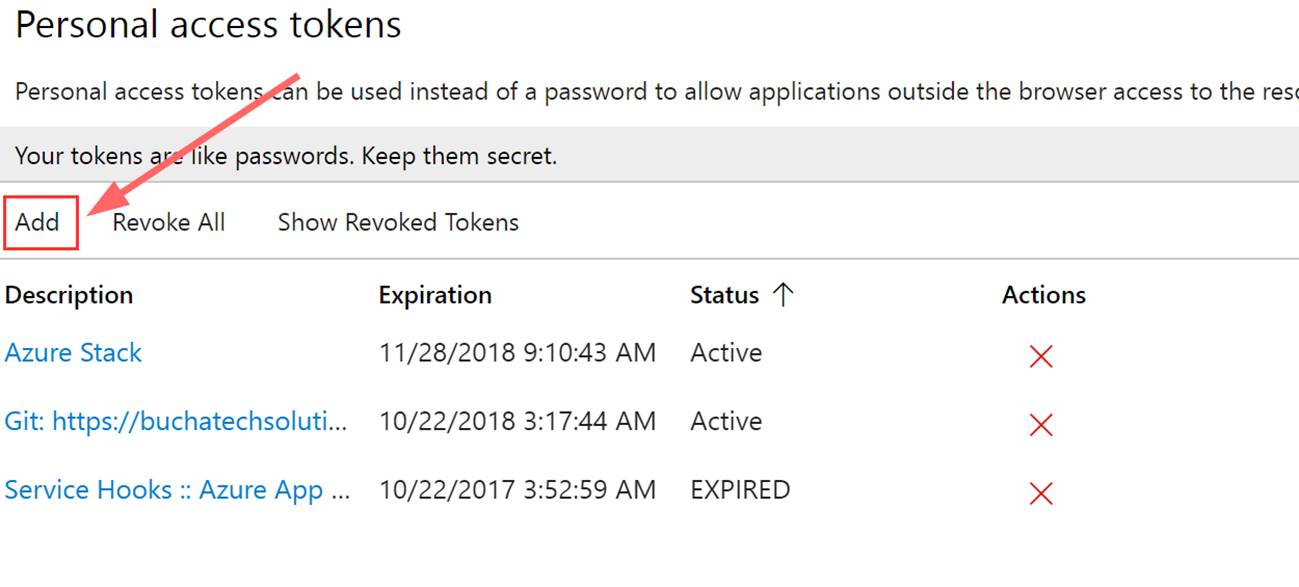
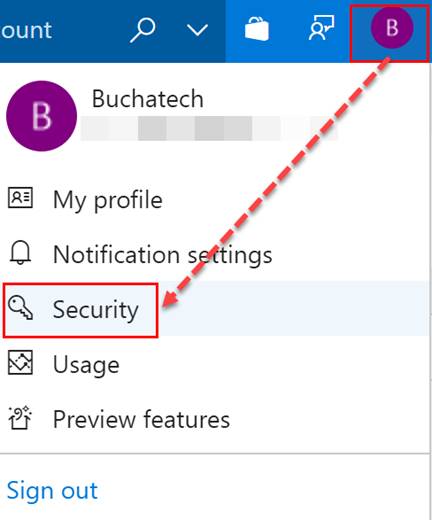
Go to Security under your profile in VSTS.

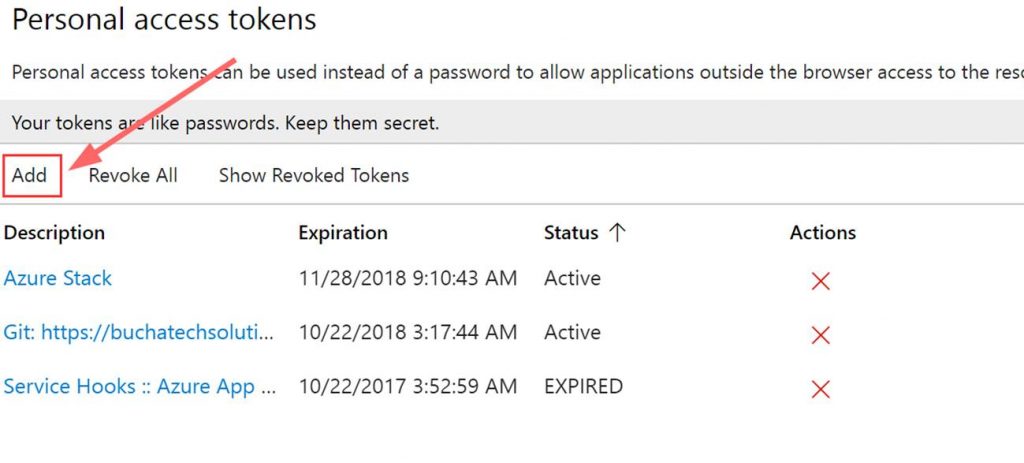
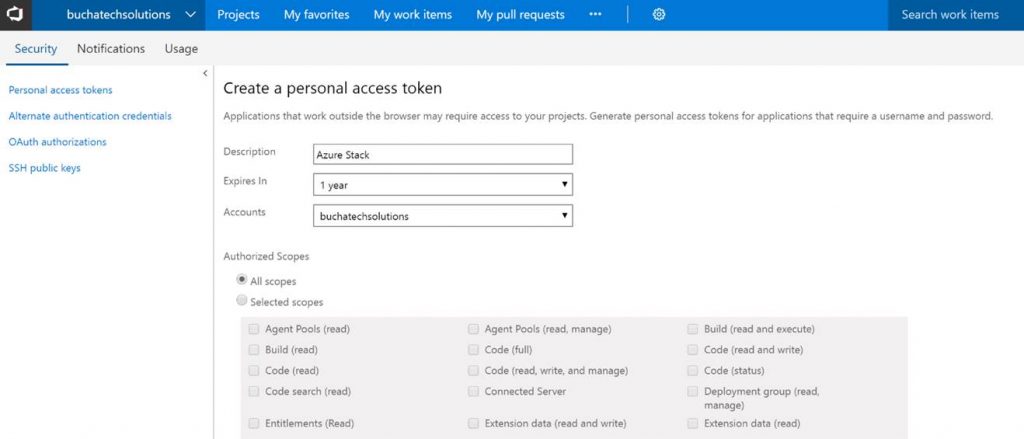
Next add a Personal access token (PAT) for Azure Stack.

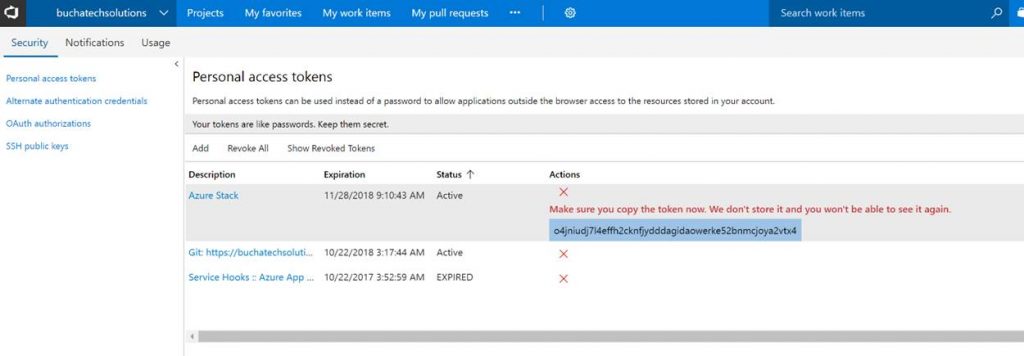
Copy the token. Note it will not be shown again ever after you leave this screen.

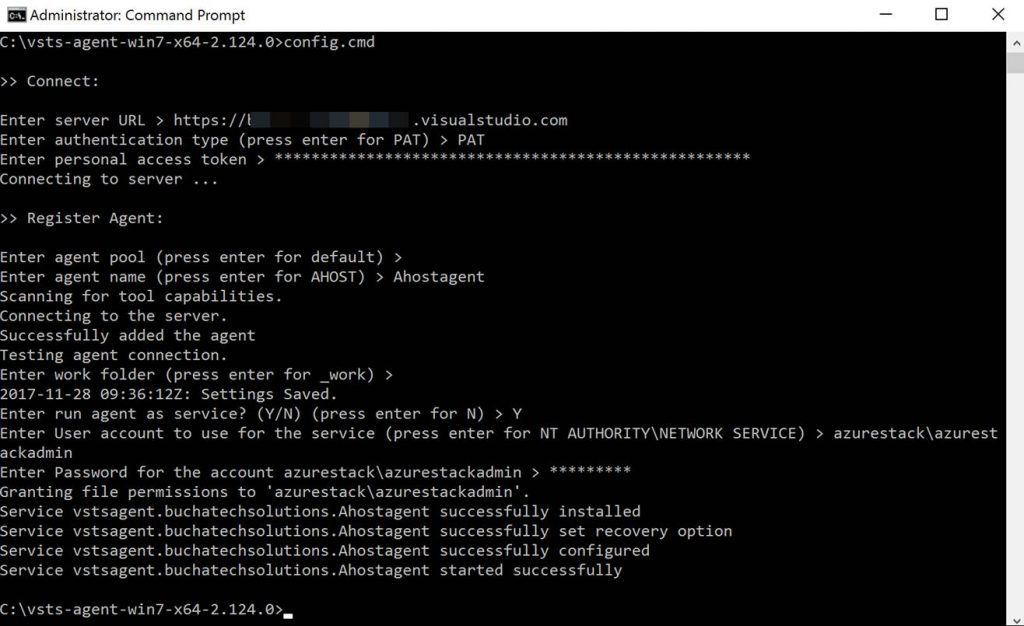
In the folder with the extracted build agent you will see the following. We need to run the run.cmd file from an elevated command prompt.

Here is a screenshot of running the run.cmd. I recommend deploying the build agent as a service. You will use your personal access token (PAT) here and the azure stack admin account.

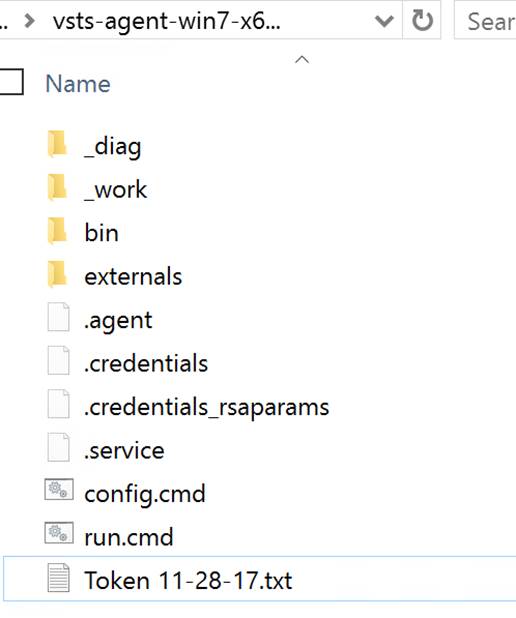
After the run.cmd finished the folder with the extracted contents should look like the following:

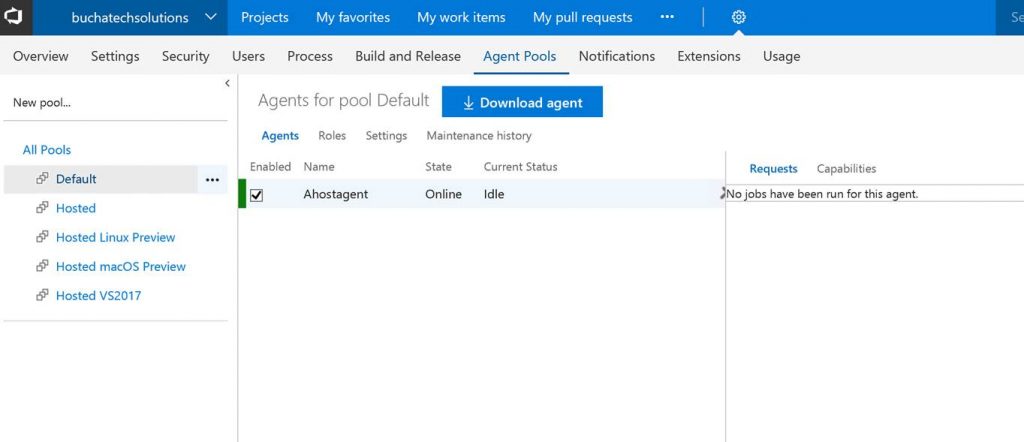
You can now see the agent in VSTS.

That’s it for the setup for connecting VSTS to Azure Stack. Next let’s look at setting up a continuous-integration and-continuous deployment (CI/CD) pipeline for VM-deployment to Azure Stack.


THE BUILD

What I cover here is focused on infrastructure as code (IaC) using ARM templates. If you need to set up CI/CD to Azure Stack for Web Apps, Mobile Apps, Containers, etc the process is the same as it is on Azure with the only difference being that you point to Azure Stack. Also note that in this post I am using the ASDK not multi-node.

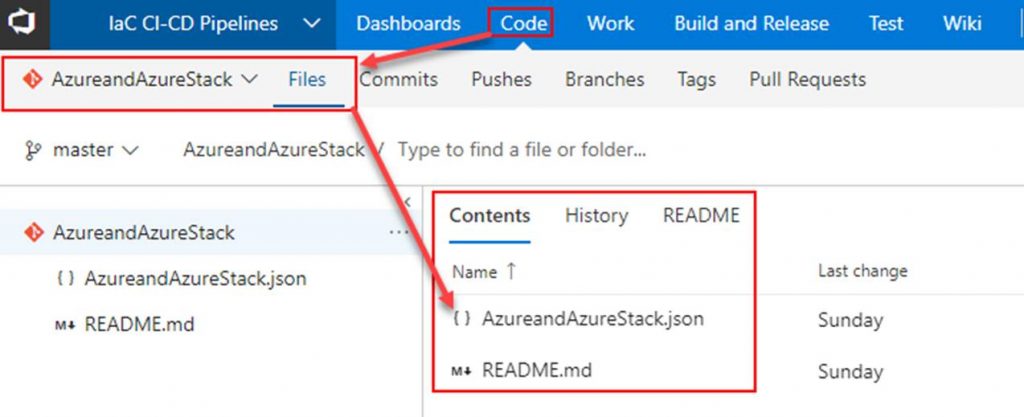
Within VSTS create a new repository and place your ARM template in it.

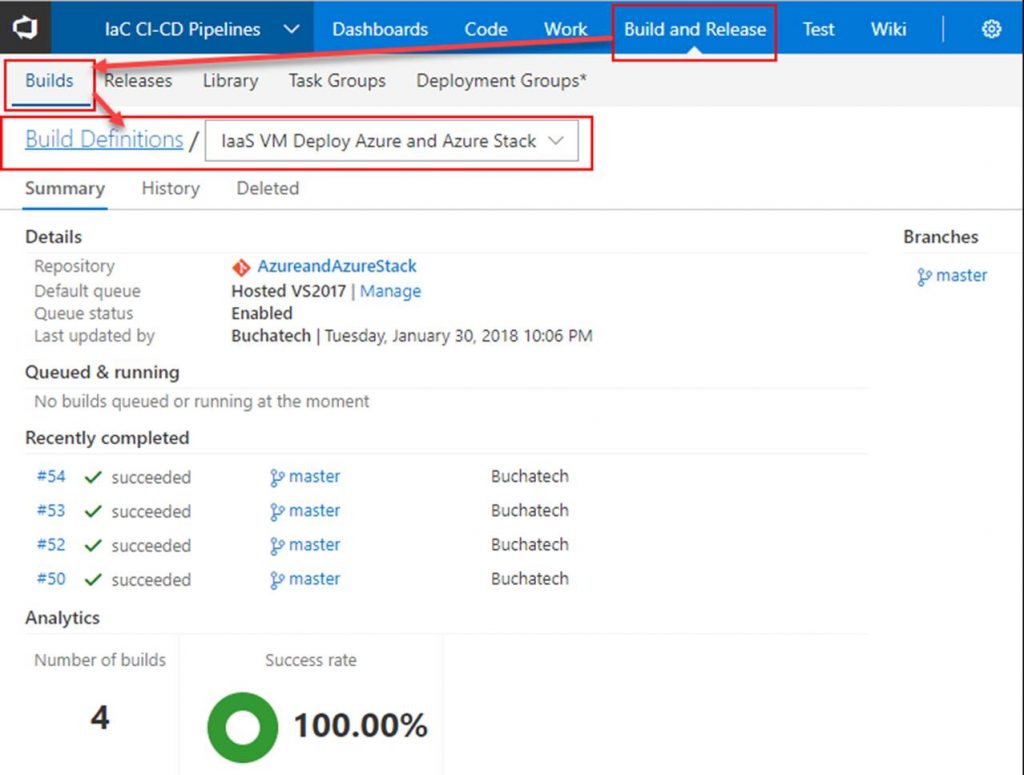
Next click on Build and Release. Create a new Build Definition.

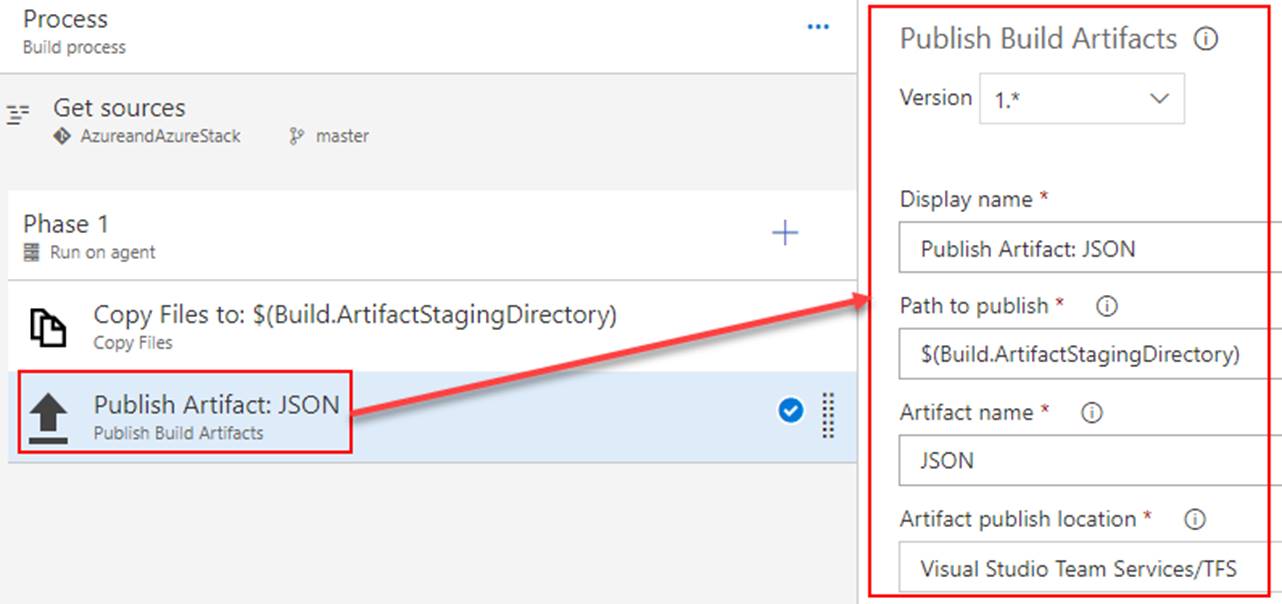
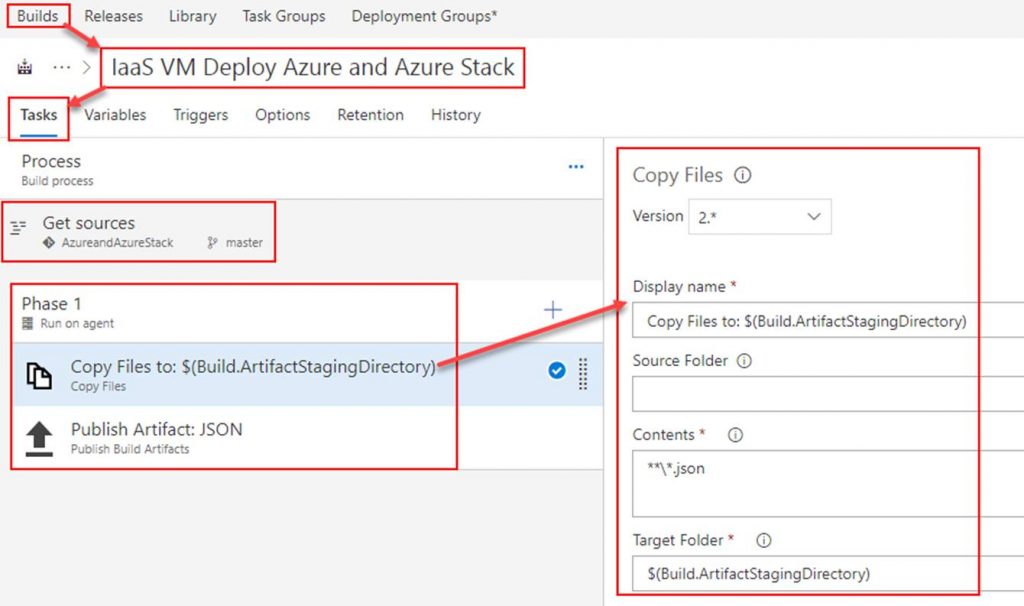
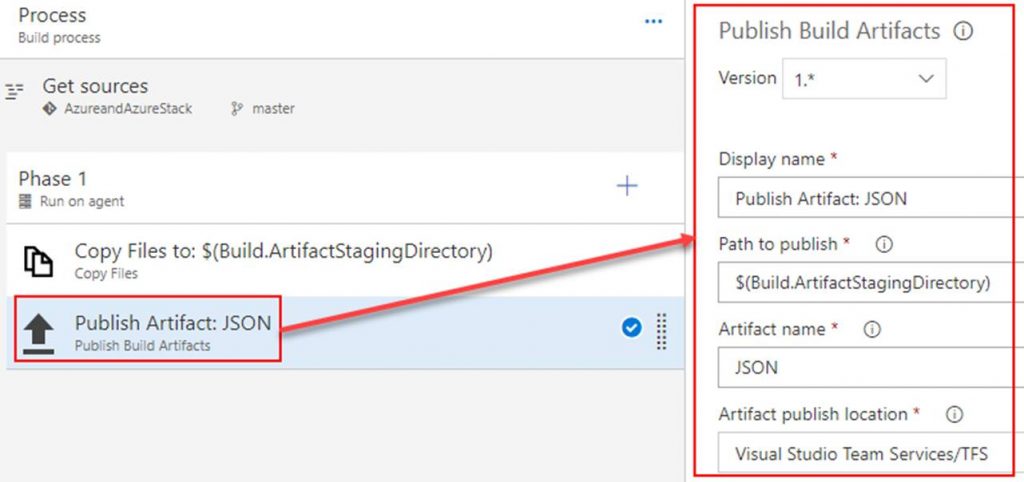
In the build definition. Point the Get sources to the repository you just created. Add 2 tasks under Phase 1. The first task will copy the ARM template to the build staging directory. The second task will publish the ARM template so that a release definition can pick it up. Both tasks are shown in the following screenshots.

Copy Files to task

Publish Artifact task

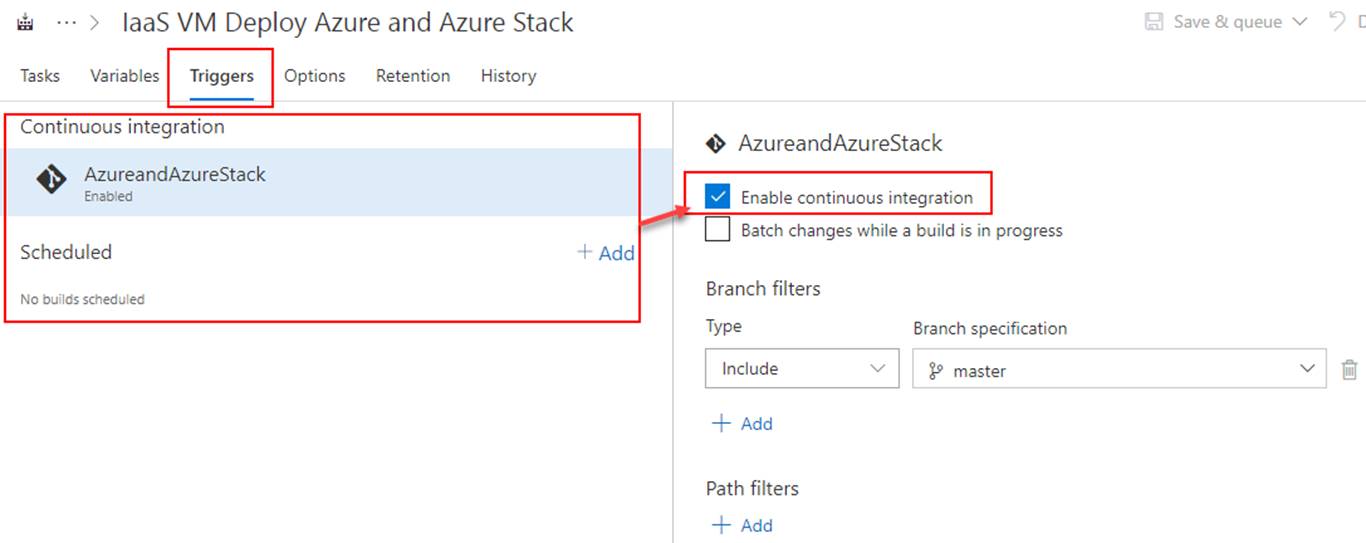
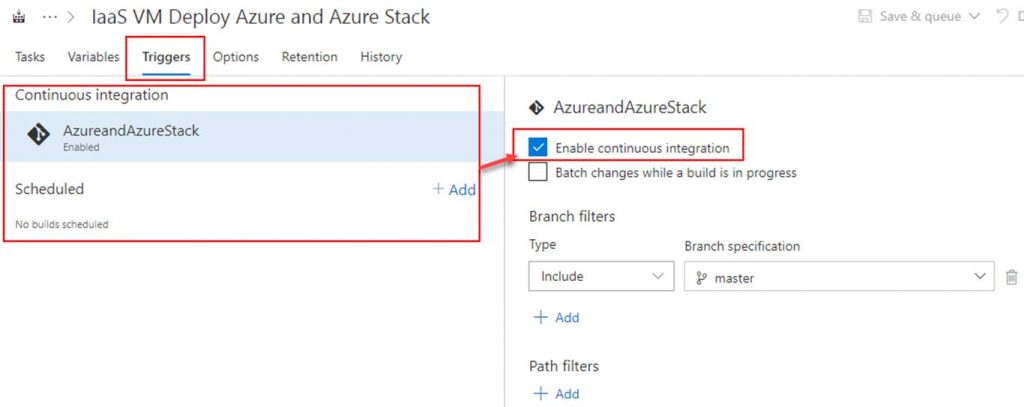
OPTIONAL: To setup continuous integration click on Triggers. Here you can set a schedule to run the builds or you can click on the repository as shown in the screenshot and then check Enable continuous integration. By checking the box next to Enable continuous integration it tells VSTS that anytime content in the repo is changed to run a build.

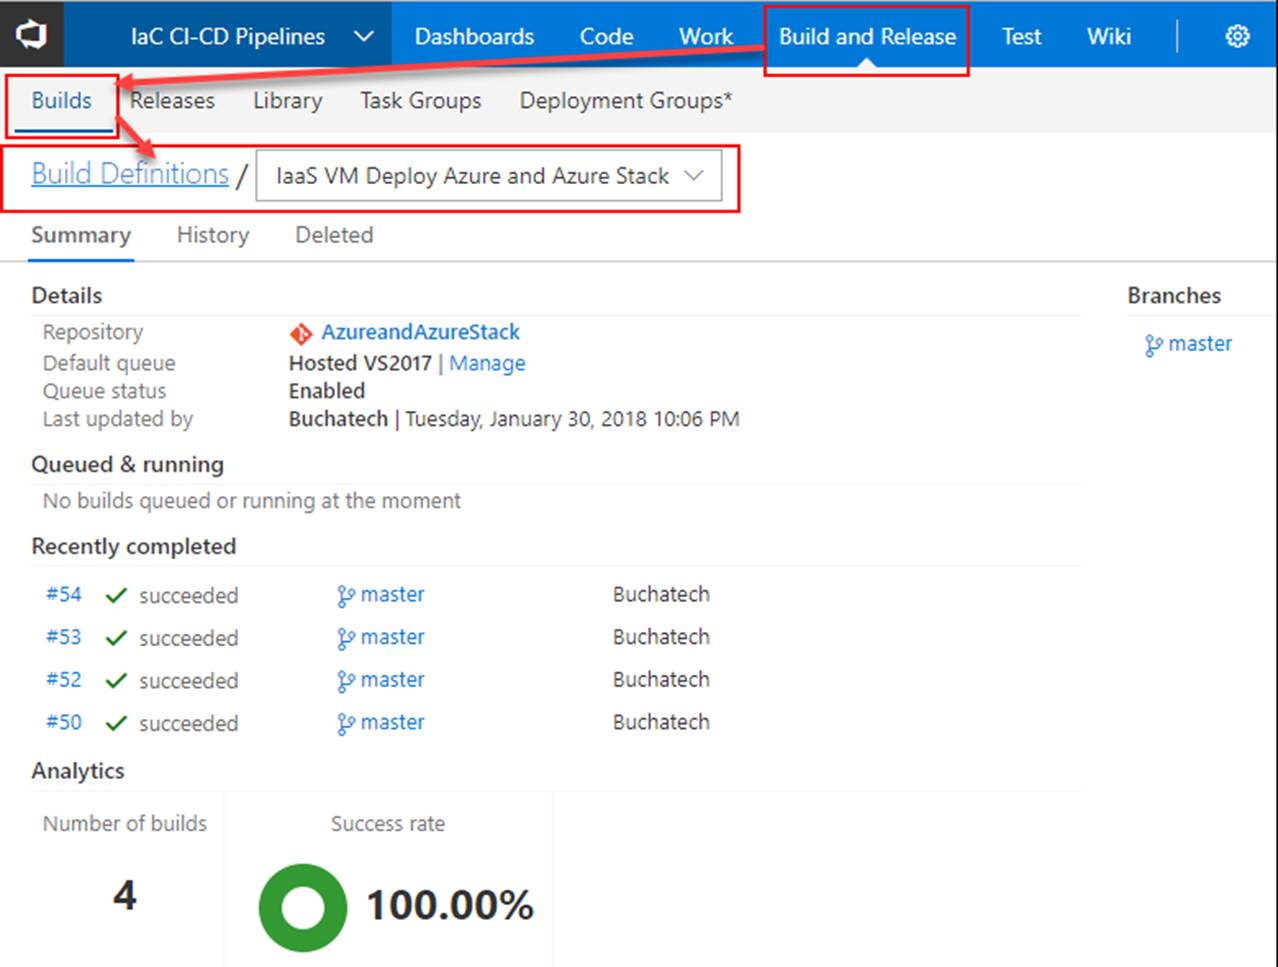
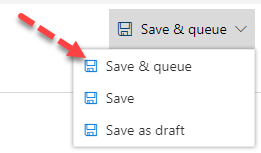
Click on Save & queue. This will start the build.

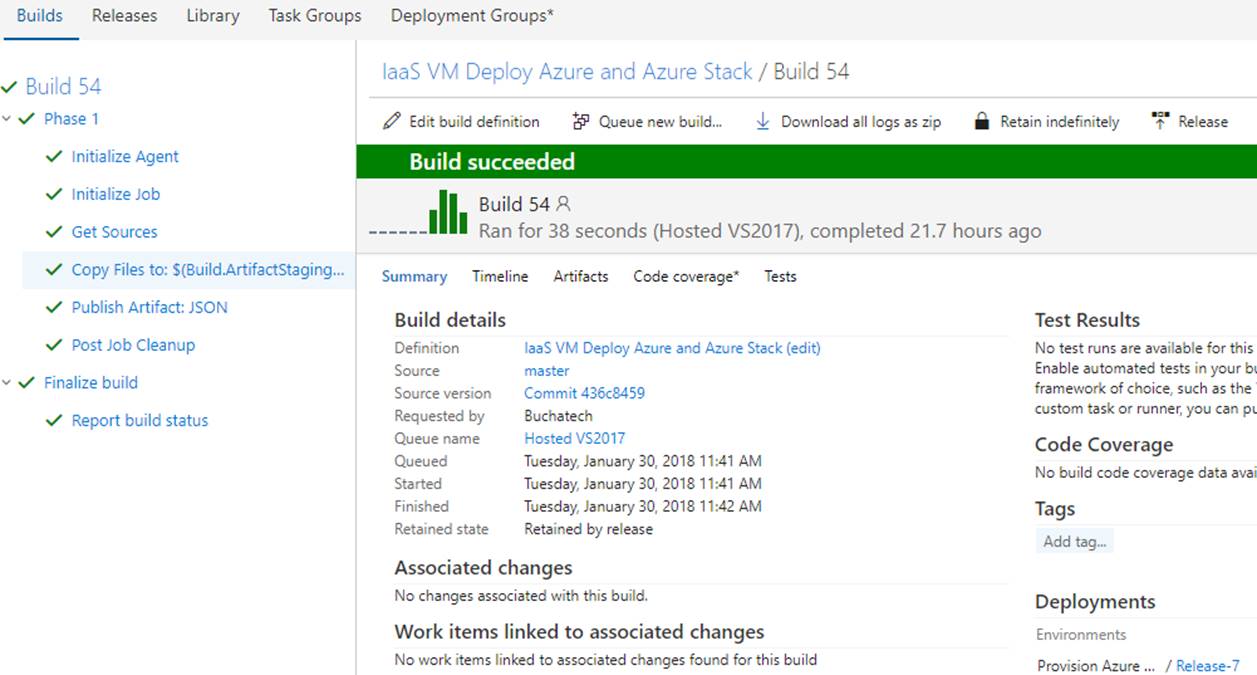
The build will start. As long as everything is setup properly within your build it will succeed as shown in the following Screenshot.

That’s all for our build. Next up we need to create a release definition (RD) pipeline. The RD will take the build artifacts and deploy to an environment/s you specify.

Read more

Monitor Azure WebJobs Status with Application Insights

Within the Azure App Service is something called WebJobs that enables developers to run a script or program in the background within the same context as a web app, API app, or mobile app. Wejobs are included in app service with no extra cost. Webjobs are often used to run regular jobs and batch work as background services. Webjobs exist to make it easier to develop, run background tasks, and scale your web applications.

Webjobs have been around for a while and are considered a part of the serverless computing available on Azure. Today Azure Functions another newer and improved serveless technology service the evolution of WebJobs. When developers need serverless today Azure Functions is typically chosen over webjobs. There are certain cases and scenarios when webjobs are still used instead of Azure Functions and I will not be diving into that topic in this blog post. For more information on when to use what serverless technology on Azure check out the following links:

– A comparison between WebJobs and Functions: Choose between Flow, Logic Apps, Functions, and WebJobs.

– Minnesota’s Azure user group meeting from December 2017 covered comparing the various serverless technologies in Azure. It was presented by Joe Koletar. The meeting notes and PowerPoint download can be found here:

http://www.mnazureusergroup.com/2017/12/22/december-2017-meeting-serverless-computing-notes-and-download

For more information on Azure WebJobs check out these two links:

– Run Background tasks with WebJobs in Azure App Service

https://docs.microsoft.com/en-us/azure/app-service/web-sites-create-web-jobs

– Develop and deploy WebJobs using Visual Studio – Azure App Service

https://docs.microsoft.com/en-us/azure/app-service/websites-dotnet-deploy-webjobs

I recently needed to setup monitoring for Azure webjobs status. In this environment there was a mix of continuous webjobs along with some triggered webjobs. Monitoring WebJobs is different compared to monitoring other Azure App Services such as web apps. Web apps can easily be monitored for up/down status and performance for things like in/out traffic, usage, and errors. Background services like WebJobs does not have a defined start or end to the work they do. WebJobs either run continuously or for short amounts of time to perform a task. In this case performance was not a concern but the status of the WebJobs was needed. You can see the status of the WebJobs in the Azure portal as shown in the following screenshot.

The problem here is this is not on a monitoring dashboard, you have to navigate here to see it, you need to click the refresh button for an update, and there is no alert setup when the status is in a non-desired state.

WebJobs does come with a logs website that shows the status of all of your WebJobs and more. This logs site is shown in the following screenshot:

The logs site is nice but the issue with it is that you have to be on the site to see the status of the WebJobs along with the previously mentioned issues viewing the status in the Azure portal. A good solution for monitoring the WebJobs would be a way to check the heartbeat of the WebJobs, the status, and alert you if one of the WebJobs is in a non-desired state. The good news is that this can be accomplished utilizing Application Insights. This is not new but does take some effort to setup.  I am going to detail how to set this up. Here is a summary of what needs to be done.

  1. Need an instance of Application Insights
  2. Need an authorization header from the WebJobs REST API.
  3. Need to create a webtest manually or using Visual Studio enterprise.
  4. Create a multi-step availability test in the Application Insights instance utilizing the webtest file.
  5. Create an alert on the availability test to notify when a WebJob is in a non-desired state.
  6. Add the results of the WebJobs availability test to a dashboard in Azure.

Let’s get started.

Read more

Azure Migrate & Azure Migrations

Migrating to Azure is a big task and should not be taken lightly. It is important to do your due diligence when embarking on this journey. There have been tools available for a while to assist in migrating to public clouds both for Microsoft Azure and non-Microsoft. Some of the tools out there have been designed and built for Azure migrations and some originally for backup and or disaster recovery but work well helping to migrate workloads. Also with cloud there is IaaS, PaaS, and even SaaS. When looking to migrate from on-premises those are the types that you look at moving to. In this blog post I will talk about migrating to IaaS on Azure and will take a look at the newly announced migration tool from Microsoft. This new migration tool from Microsoft is called Azure Migrate. It was announced here: https://azure.microsoft.com/en-us/blog/announcing-azure-migrate and it is still in a limited preview. The most common type of migration project from on-premises to Azure is known as a Lift and Shift to IaaS. This is the standard approach including the tooling:

Stage 1: Discover and assess on-premises environment and workloads that will be moved to Azure.

Stage 2: Stage targeted environments in Azure.

Stage 3: Replicate servers up to Azure.

Stage 4: Optimize migrated workloads i.e. security, backup, sizing, performance, and cost.


The typical tooling used mapped to each stage is as follows:

Stage 1: Azure Migrate or 3rd party (Manual, Movere, Cloudamize, DynaCenter, CloudEndure, Unitrends, Stratozone, CloudAtlas and more)

Stage 2: Azure portal, PowerShell, ARM

Stage 3: Azure Site Recovery (ASR)

Stage 4: Security Center, Azure Backup, ASR, OMS, and Cloudyn


Now it is common in stage 1 to assess workloads that can move to SaaS or PaaS. Below is a Workload Cloud Migration Decision Tree that can be used to help determine the placement of workloads as you look at migrating to the Azure:

This decision tree flow is from the Azure Operationalized session MVP Natascia Heil and myself delivered in 2017 at MMS. Notice in the Workload Cloud Migration Decision Tree that SaaS is first then PaaS, then IaaS and finally Hybrid Cloud. That is the order workloads should be targeted in as the top typically has the lowest cost and greatest amount of savings when moving to cloud. Also take note that Hybrid Cloud is Azure Stack.

Reminder in this blog post we are only talking about IaaS as that is what the Azure Migrate tool can help with as of now. This may change later expanding to cover PaaS and I hope it does!

Azure Migrate was announced at Ignite 2017. It is still in a limited preview. I am fortunate to have access to it and was given the green light to blog about it. Azure Migrate can help with stage 1 of an Azure migration project. Azure Migrate helps eliminate a fair amount of the manual work needed in Azure migration projects. Currently Azure Migrate only evaluates environments and workloads running in VMWare vSphere. Later the goal is to add Hyper-V and physical servers as platforms that can also be assessed.

Azure Migration helps you assess Azure readiness, Size recommendations, Monthly cost estimate, and visualizing dependencies. These breakdown as:

Azure readiness of on-premises virtual machines. This looks at things such as the type of BIOS, OS version.

Size recommendations gives you a recommended Azure IaaS VM sized based on the VM’s on-premises performance history.

Monthly cost estimate is the total cost you will incur running your servers in Azure. This is broken down as compute and storage costs.

–  Visualizing dependencies is basically utilizing Service Map to visualize dependencies between servers so you can scope out servers that make up a workload at the application level and quickly determine any potential issues with migrating.


The Azure Migrate tool looks at the following items as a part of the assessment:

Target location

The Azure location to which you want to migrate.

Storage redundancy

The storage option that Azure VMs will use after migration. Currently, Azure Migrate supports only Locally redundant storage (LRS) only.

Pricing plans

The assessment takes into account whether you’re enrolled in Software Assurance and can use the Azure Hybrid Use Benefit, and whether you have any Azure offers that should be applied. It also allows you to specify any subscription type.

Pricing tier

Azure Migrate allows you to specify the pricing tier (basic/standard) of the Azure VMs. This helps you migrate to the right Azure VM family, based on whether your on-premises environment is in production or not.

Performance history

By default, Azure Migrate evaluates on-premises machine performance using a month of history, with a 95% percentile value. This can be modified.

Comfort factor

Azure Migrate considers a buffer (comfort factor) during assessment. This buffer is applied on top of the utilization data of VMs (for CPU, memory, disk and network). The comfort factor is added to account for matters such as seasonal usage, short performance history, and likely increases in future usage. For example, normally a 10-core VM with 20% utilization will result in a 2-core VM.

Note: Above list is from the limited preview user guide and subject to change once Azure Migrate is out of preview.


Overall I found Azure Migrate easy to setup, configure and use. Now let’s check out the tool.


When you go into the Azure portal you basically create a new migration project. This is stored in it’s own resource group. You can create multiple of these.

When you create an Azure migration project it creates an OMS workspace and deploys the Service Map solution. This can be seen in the following screenshot.

After creating the project you then need to perform the discovering and assessment.

To perform the discovery Microsoft gives you a appliance in the form of a VMware virtual machine image. This is the migration collector. You spin it up in your vSphere environment, connect it to your VMWare environment and let it collect data on all or a specified set of virtual servers.

In the following screenshot you can see the collector running.

After it is running you need to log into it via the VMWare console or RDP. You need to ensure the VMware PowerCLI module is installed and then you run the Azure Migrate collector wizard. On the desktop of the collector machine’s desktop you wil see the VMWare PowerCLI for installing it and the collector wizard.

This is a screenshot of the VMWare PowerCLI install.

Below in the following screenshots is what the collector wizard looks like. On the first screen accept the pre-reqs and click continue. On the second section you are going to point the collector at your VMWare environment to collect either or specific VM’s that you plan to migrate to Azure.

Next you need to input credentials for the Azure Migration project that you created in Azure. Below is a screenshot of the ID and Key.

Input the ID and key as shown in the screenshot below.

After you click continue the wizard will discover the machines and upload the date to your Azure Migration project. This can take a while so go get some coffee at this point.

After it is done go back to the Azure portal and go to Migration projects. This is where you will see the Azure migration project you created and the details of your assessment.

Below are two screenshots one without assessments and one with assessments.

Without any assessments

With some assessments

On the left hand side under manage you can click on assessments to create an assessment. You can create a new group or select an existing group for the machines to belong to.

The following screenshot is what the assessment overview will look like.

You can change many important things for your migration by clicking on Edit properties. Here you can change the target location for the VM’s storage type, offer type, use of hybrid user benefit and much more.  There is a property here names comfort factor. If the comfort factor is set to of 1 the migrate tool will provide only exactly what is needed if this is set higher for example to a comfort factor of 2 then the migrate tool will double the VM size recommended by Azure migrate.

If you click on Azure readiness it will show you the migration readiness details about your VM’s. Here you will see any machines that will have migrations issues and what those issues are so that you can remediate them. After you remediate this will update.

If you click on a machine it will give you details about that specific VM.

If you click on Cost details you will see a breakdown of monthly compute and storage costs. It will break this down per machine.

There is a feature in Azure Migration called Dependency visualization. Dependency visualization will map out the dependencies between servers and applications to help point out any potential issues up front. This feature leverages Service Map within OMS. In order for Service Map to pick up the dependencies on the machines we need to have the OMS MMA agent and the Service Map dependency agent installed on them. This has to happen even before they migrate.

The following screen shows the MMA agent and dependency agent install steps.

They way to access the dependency visualization screen is to drill down into a group and then click on View dependencies button as shown in the following screenshot.

You will be brought to the Service Map dependencies screen where it shows the dependencies to help identify these before migration to Azure.

That concludes this blog post. Hopefully you found the information about Azure Migrations useful and enjoyed this early look overview of the new Azure Migrate tool.

Read more

Monitoring Azure PaaS

I recently had the opportunity to present at the annual SCOM/OMS Day held by the MN System Center user group. Here is a link to the past event https://mnscug.org/meetings/499-october-2017-mnscug-meeting. Other presenters during this event included Microsoft MVP Cameron Fuller, Microsoft MVP Bob Corenelissen, and Nathan Foreman, another Minnesota local. I chose to present on Monitoring Azure PaaS. In this blog post I will cover the information from my presentation and dive deeper into the topic.

Defining PaaS

Before you can monitor something you need a full understanding of what it is that you will be monitoring. Let’s start out by clarifying what PaaS is. There are many facets to cloud and the services that are available in cloud. You also can utilize public cloud, run your own private cloud or utilize a combination of the two known as hybrid cloud. Regardless if you have public, private, or hybrid cloud you can leverage Infrastructure as a Service (IaaS), Platform as a Service, and Software as a Service.  Below is an image that has been around for a while that visually explains the main differences between running your own data centers and utilizing cloud.

After viewing the previous image lets dive a little bit deeper into what it is explaining. When you run your own data center/s you are responsible for EVERYTHING all the way down to the networking and storage including monitoring all of that. As you move to the cloud you reduce your administrative overhead releasing that to the cloud vendor.

Most organizations first foray into cloud is to utilize IaaS. With IaaS you take a lift and shift approach of essentially running your existing servers and or new servers in cloud as virtual machines. At this layer you no longer have to worry about and manage the hypervisor, servers, physical storage, and physical networking. At the IaaS layer you still need to manage and monitor what is running on the servers that power workload and applications consisting of things like the OS, middleware, data and the applications. You also manage and monitor software defined storage and networking.

As organizations move to PaaS in cloud you release even more to the cloud vendor reducing even more administrative overhead. Also with PaaS the cost of the cloud services decreases. With PaaS you are responsible for the applications and data. You no longer need to worry about maintaining the administrative tasks of the applications, middleware or the OS.

Examples of some Azure PaaS services are Web Apps, Mobile Apps, API Apps, Media Services, CDN, Search, Event Hubs, Notification Hubs, Service Bus, Batch service, Azure AD, B2B/B2C, Azure DNS, Storage, SQL/MySQL/Postgres databases, CosmosDB, Service Fabric, IoT, Azure Functions, Logic Apps, Azure Container Service, Redis Cache, HD Insight, Key Vault, Azure Bot service, and much more.

Let’s zero in on SQL as a service in the cloud. With traditional SQL you had to properly scope and size the server properly, ensure you have enough storage space, split data, logs etc. After that you would need to plan and make SQL highly available, tune a SQL server for performance, maintain it and more. With PaaS the majority of this goes away. In fact with PaaS there is no SQL server/s to manage anymore. With PaaS when developers or anyone in IT need a SQL database they simply go spin it up. IT can still put controls in place such as policy and governance standards that are essentially boundaries that the consumer of the service needs to stay within however it is all self-service.

Now even though SQL databases can be spun up by consumers on their own and the SQL servers are managed by the cloud vendor (Microsoft). Now you would think in a cloud PaaS model you no longer need to monitor as there is no SQL server/s to administer. This is simply not true and we will get more into the monitoring aspect more later on in this post.

Applications running in Azure are typically made up of multiple PaaS services and sometimes a PaaS service itself will have dependencies on other PaaS services. An example of this can be seen in the following Application Map.  This shows that PaaS services have many moving parts across multiple parts and can be complex.

With PaaS components that make up applications it is important not to just monitor the components but also the application itself.

Why Monitor PaaS?

Most folks automatically think that they don’t need monitoring of PaaS because they assume without servers and high availability they don’t need to. This simply is not true. Below is a list of reasons of why it is important to monitor PaaS.

Overall when it comes to PaaS best practice is to move away from the old ways of thinking and methods for monitoring servers and on-premises infrastructure and move to a focus of monitoring the business applications.

Understanding the monitoring framework in Azure

Next up let’s take a look at the framework of monitoring in Azure. This will help you to better understand what is possible and how the monitoring tools plug into this framework. There are three main areas of data that is generated by Azure services that can be leveraged in monitoring. These sit across IaaS and PaaS services. These areas are:

  • Diagnostic
  • Logs emitted by an Azure resource that provide rich, frequent data about the operation of that resource.
  • Resource-level diagnostic logs require no agent and capture resource-specific data from the Azure platform itself.
  • Can send these to OMS Log Analytics, Event Hubs, or an Azure Storage account.

_______________________________

  • Metrics
  • Gain near real-time visibility into the performance and health of Azure workloads.
  • Performance counters are emitted by most Azure resources.

_______________________________

  • Activity Log
  • Insight into subscription-level events that have occurred in Azure.
  • Determine the ‘what, who, and when’ for any write operations (PUT, POST, DELETE) taken on an Azure resource in a subscription.
  • Categories of data: Administrative, Service Health, Alert, Autoscale, and Recommendation. (Policy, Security, and Resource Health coming…)

The types of monitoring data sit at different layers on IaaS and PaaS. On IaaS the application logs and metrics come directly out of the application. Diagnostic logging sits across the application and OS layer while metrics sit across the OS layer and VM layer. The activity logging sits at the Azure infrastructure layer.

On PaaS both the diagnostic logging and metrics come from the Azure resources directly. The activity logs again are at the Azure infrastructure layer.

With the diagnostic logs and metrics you can access and configure these via the Azure portal, PowerShell, Azure CLI and many have API.

Diagnostic logs can be sent to OMS log analytics, Event Hubs or Azure storage for other consumption. Metrics can also be sent to OMS log analytics, Event Hubs, Azure storage, and Application Insights. With Metrics you can also fire off alerts and autoscale a service. Alerts can kick off emails, webhooks, and Azure Automation runbooks. The following diagrams visually breakdown what can be done with metric and diagnostic log data.

Options for monitoring Azure PaaS

When it comes to monitoring PaaS Microsoft has many options available. There also are options available from a ton of 3rd party vendors. In this blog post I will only talk about the Microsoft options. Majority of the monitoring tools from Microsoft that can monitor PaaS are cloud based but you also can do some PaaS monitoring via System Center Operations Manager. The cloud options are much faster, easier to onboard and have been built from the ground up with cloud in mind. With Azure you also have out of the box monitoring capabilities on most of the Azure services. For example with a web app in Azure on the overview blade you can see things like data in and out and the Azure Response Time as shown in the following screenshot.

It is great that we get some monitoring out of the box for PaaS services, however this does not help when you are running hundreds+ of services. To handle enterprise scale monitoring of PaaS services you need to centralize the monitoring and that is where the monitoring solutions come in. Microsoft has 4 cloud based monitoring tools to help centralize your Azure monitoring. These tools are able to scale as needed without any hard limits. SCOM is a 5th monitoring tool that can monitor Azure. SCOM is on-premises only though. Here is a screenshot of the various tools minus SCOM:

Here is an example custom PaaS monitoring dashboard in Azure combining widgets from the various monitoring tools:

Now let’s dive into what each tool is and an example of when and how you would use them to help monitor Azure PaaS services.

Application Insights is a Application Performance Monitoring (APM) solution used to monitor applications all the way down to the code. Application Insights is typically used for web apps and other Azure PaaS services to detect, triage, and diagnose the root cause of issues. Application Insights gives you the ability to monitor many things about your applications such as availability, metrics like data coming in and out, dependency mappings through application map, performance data, and even live streams of data points. The following screenshot is an example of a web app in Application Insights.

The following screenshot is an example of an availability test summary chart in Application Insights. It is a ping test pointed to a URL. It gives you the % of the apps availability, the successful tests and failures.

With the availability ping test you have control over a bunch of options such as the frequency, success criteria, any needed alerts upon failures, and the ability to select the locations the test runs from.

Here is an Example use case for Application Insights:

  • Debug a multi-tier Azure .NET web application for errors and performance issues.
  • Utilize Application Map in Application Insights to discover visually which parts of the application are unhealthy. For the parts that are not healthy drill down using Application Insights to pinpoint the root cause of the errors.

OMS stands for Operations Management Suite. OMS is goes beyond just a tool that can be used for monitoring. It is a suite that also provides, backup, DR, automation and security. It extends to on-premises and it can monitor both IaaS and PaaS. OMS is a platform and has something called solutions. Solutions are used to extend the functionality of OMS. The solutions are packaged management scenarios. I am not going to list out or dive into all of the solutions available for OMS here. Solutions can be found directly in OMS or from the Azure Marketplace. There are a bunch of OMS solutions that can be used to help monitor and gain insight into your Azure PaaS services. The following screenshot has some of the PaaS related solutions that are available for OMS.

In the previous screenshot the OMS solutions with the white background can be found in the Azure Marketplace while the other OMS solutions will be found directly in OMS. More and more solutions are being added to OMS and the Azure Marketplace all the time.

Below is a screenshot of the Azure Web Apps Analytics OMS solution used to gain insight into an Azure web app/s.

Below is a screenshot of Azure Storage Analytics OMS solution from the Azure Marketplace used to monitor and gain insight into Azure storage.

OMS example use case for monitoring Azure PaaS:

  • Front end application can sometimes connect to a SQL database; and sometimes it cannot. Suspected cause is SQL timeout.
  • Utilize the Azure SQL Analytics to drill-down into SQL timeouts that have occurred on databases.

Azure Monitor provides a consolidated place for monitoring data from Azure services and base-level infrastructure metrics/logs from Azure services. It is typically used to track performance, security, and identify trends on Azure services. Azure Monitor brings (OMS) log analytics, application insights, and even network watcher into one place. Azure Monitor is still a relatively new service in Azure and it is still taking shape. Azure Monitor does offer some data that (Application Insights and OMS do not). The data you cannot get in OMS and Application Insights includes the history of Azure service issues, planned maintenance, health advisories, health history, and Azure activity logs.

An example use case for using Azure Monitor to help monitor Azure PaaS is:

  • Need a report of all services issues for a specific region for the past 3 months.
  • Utilize health history in Azure Monitor to pull a list of all service issues for a specific region from the past 3 months. This example can be seen in the following screenshot.

The following screenshot shows the following areas in Azure Monitor that have important Azure monitoring data.

Azure Monitor also has the ability to integrate with many 3rd party solutions that are used by DevOps folks today. The following screenshot is a group of 3rd party integrations that are available for Azure Monitor.

SCOM can be utilized if you want to monitor Azure resources from on-premises you can utilize SCOM for this. There is a management for Azure. There also is a SCOM management pack for Azure Stack. The SCOM management pack for Azure Stack is used to monitor Azure Stack’s fabric. In order to monitor Azure Stack’s IaaS and PaaS you would use the Azure management pack pointing it to your Azure Stack enviroment. The Azure management pack can monitor the availability and performance of Azure resources that are running on Microsoft Azure via Azure REST APIs.

Azure services that can be discovered and monitored with the Azure SCOM management pack.

Below is a diagram of how the health rolls up in the Azure SCOM management pack.

Where to get the Azure Management Packs

Azure Management Pack:

https://www.microsoft.com/en-us/download/details.aspx?id=50013

Azure Stack Management Pack:

https://www.microsoft.com/en-us/download/details.aspx?id=55184

But what about security?

This is where Azure Security Center comes into play. Security Center is a unified security management and advanced threat protection for workloads running in Azure, on-premises, and in other clouds.

Thanks for reading and stay tuned for more blogs on Azure and Azure Stack.

Read more

Azure Stack SQL RP – Need Azure PowerShell with version 1.2.9 Error

I ran into this error when installing the Azure Stack SQL RP on the Azure Stack Development Kit:

Azure Powershell Module with 1.2.10 version found. Need Azure Powershell with version 1.2.9. Please uninstall the “current version and rerun the RP setup

If you look at the SQL RP doc here:

https://docs.microsoft.com/en-us/azure/azure-stack/azure-stack-sql-resource-provider-deploy

It says “If you have installed any versions of the AzureRm or AzureStack PowerShell modules other than 1.2.9 or 1.2.10, you will be prompted to remove them or the install will not proceed. This includes versions 1.3 or greater.” on step #6 under Deploy the resource provider.


On my ASDK host I had:

and

The funny part is that in the SQL RP deployment script titled has a line where it installs AzureStack 1.2.10 but this is the version that the SQL RP deployment script is complaining about. Here is the syntax from the SQL deployment script.

# Installs and imports the API Version Profile required by Azure Stack into the current PowerShell session.

Use-AzureRmProfile -Profile 2017-03-09-profile

Install-Module -Name AzureStack -RequiredVersion 1.2.10 -Force

So the next thing I tried to do was run:

Get-Module -ListAvailable | where-Object {$_.Name -like “Azure*”} | Uninstall-Module

It kept throwing these warnings and errors:

WARNING: The version ‘1.0.4.4’ of module ‘Azure.Storage’ is currently in use. Retry the operation after closing the applications.

PackageManagement\Uninstall-Package : Module ‘Azure.Storage’ is in currently in use.

At C:\Program Files\WindowsPowerShell\Modules\PowerShellGet\1.0.0.1\PSModule.psm1:2157 char:21

+ …        $null = PackageManagement\Uninstall-Package @PSBoundParameters

+                    ~~~~~~~~~~~~~~~~~~~~~~~~~~~~~~~~~~~~~~~~~~~~~~~~~~~~~~

    + CategoryInfo          : InvalidOperation: (Microsoft.Power…ninstallPackage:UninstallPackage) [Uninstall-Package], Exception

    + FullyQualifiedErrorId : ModuleIsInUse,Uninstall-Package,Microsoft.PowerShell.PackageManagement.Cmdlets.UninstallPackage

So now I was stuck in this endless loop of PowerShell module uninstall and install hell. For a moment I thought I went insane. After recovering from temporary insanity. I ran this:

Get-InstalledModule -Name “AzureStack” -RequiredVersion 1.2.10 | Uninstall-Module

No errors on this. I then ran:

Get-Module  -ListAvailable | where-Object {$_.Name -like “Azure*”}

to see if the module was gone. Boom it was!

I then kicked off the SQL RP deployment script again and this time it worked!

NOTE: If you somehow have AzureRM version 1.2.10 just run Get-InstalledModule -Name “AzureRM” -RequiredVersion 1.2.10 | Uninstall-Module to get rid of that guy.

Read more

Azure Stack Development Kit (ASDK) Deployment Step by Step

At Microsoft Inspire Microsoft announced the Azure Stack Development Kit (ASDK) as a replacement to the POC and the general availability of the production Azure Stack named Azure Stack Integrated Systems. The Azure Stack Development Kit is here to stay. This will remain single node and should be used for trying out Azure Stack. You can develop your ARM templates and or applications on it and they will work on a production Azure Stack. The Azure Stack Integrated Systems are the ones that you buy from the OEM partners HP, Lenovo, Dell and soon to be Cisco, Avanade, and Huawei.

The ASDK install has improved 1,000 times over the previous TP’s of Azure Stack. I am going to detail the steps in this blog post. The steps start after you have downloaded the Azure Stack cloudBuilder.vhdx. Here we go:

PREPARE AZURE STACK HOST SERVER:

First off download the Azure Stack tools onto your Azure Stack host server. Just download all the tools as you will need all of them at some point. They can be found here: https://github.com/Azure/AzureStack-Tools

I put these in a folder on the C: drive named ASTools. I extract them and place them in the root.

Open up an elevated PowerShell window, navigate to your Astools folder and run the asdk-installer.ps1 script. Next a GUI wizard will pop-up.

Click on Prepare Environment.

Point it to your cloudBuilder.vhdx and click Next.

Put in the host servers local admin password. Make sure this matches the Azure account you plan to use.

Select the other options as you see fit.

It will run for a while creating the unattended file for Windows Server 2016.

Once it is done click Reboot now.

DEPLOY AZURE STACK DEVELOPMENT KIT:

Next lets deploy Azure Stack. After the server has rebooted log onto your AS server. Use the localhost\administrator account and the password you set.

Once again from PowerShell run asdk-installer.ps1. A GUI wizard will come up. Click on Install.

Select Azure Cloud (Azure Active Directory) or ADFS. Put in your directory and password.

Verify and select the correct NIC.

Select DHCP or put in your static IP settings.

It will verify the network settings.

You will see the PowerShell deployment script that will be run. Click on Deploy!

The PowerShell deployment will kick off in a PowerShell window.

After a little bit (1-2 minutes) an Azure login window will ask for your Azure account creds. This is the account ASDK will be deployed under.

NOTE: We still have the log folder and files under CloudDeployment on the C drive.

A few hours later and there it is successfully!

Having been involved with Azure Stack since TP1 and losing about a week to deploying Azure Stack TP1 this is a much….much better deployment experience. Nice work Microsoft Azure Stack team!!!

Read more

OMS and Cherwell ITSM Integration

Microsoft recently released public preview of OMS and ITSM integration. Here is the link for that announcement:

https://blogs.technet.microsoft.com/msoms/2017/05/11/it-service-management-connector-public-preview

Microsoft has built an ITSM connector in OMS. This new ITSM connector can connect to many ITSM solutions out there. The ITSM solutions it can connect to are:

  • System Center Service Manager (SCSM)
  • Cherwell
  • ServiceNow
  • Provance

This new ITSM connector is bi-directional meaning work items can flow from the ITSM solution into OMS and OMS can create work items in the ITSM solution such as incidents, alerts, and events. Hopefully in the future OMS could be used to populate a CMDB and even create application maps from OMS’s Service Map.

I wanted to give this a test run with a test Cherwell instance that I have. There is official documentation for the integrations. The documentation is good however after setting this up I did find that there could be a few more steps spelled out as well as screenshots with the Cherwell piece.

Needed settings from Cherwell:

Before you set the connection in OMS go and get the information you will need. So you will need a username and password of an account that has access to Cherwell, the Cherwell URL, and a Cherwell Client ID.

If you don’t know your Cherwell URL you can get this from the Cherwell client console. Launch Cherwell.

Before you login you can edit the connection to see the URL as shown in the screenshot. You will want to copy this to use in the OMS ITSM connector setup.

Note that you do not want to copy the entire URL. Only copy to the .com like https://test.demo.cherwell.com.

Next we need to generate the Client ID. The Client ID is basically a generated string called the client key used for connecting to Cherwell’s API. To get this client ID Launch the Cherwell Administrator console.

Login and click on Security and then Edit REST API client settings.

A window will pop up and you will need to click on the green plus to create a new one. Give it a name and copy out the Client Key.

Copy this as you will need it later.

Setup in OMS:

Next log into OMS and add the ITSM Connector preview. It is shown in the screenshot below.

After this has been added go to your OMS settings screen click on Connected Sources>ITSM Connector and then click on Add New Connection.

Select Cherwell for the connection type add in your Cherwell settings and save it. If everything worked your OMS is now connected to Cherwell.

Exploring the ITSM Connector:

Next let’s check things out in OMS. Before I did that I first went and created a new incident so I could see this flow over into OMS. So I created the following over in Cherwell:

After doing that I went back into OMS and kicked off a sync because I did not want to wait.

The connector picked up my new incident right away. You can see the dashboard ITSM tile has 2 incidents.

After clicking into this I am brought to the full ITSM dashboard. I then clicked on the Incident tile.

I was then brought to the incident dashboard and I could see the new incident I created.

I clicked on the new incident and it brought me to the OMS search with the details of the incident. Very cool!

I am excited to see cool stuff like this in OMS and integration with many ITSM tools. Look out for more blog posts in the future about ITSM Integration in OMS as well as in Azure Stack.

Read more