Azure Kubernetes Service (AKS) service Azure App Service Environment (ASE) Azure Service Fabric (ASF) Comparison
Scenario:
So, your team recently has been tasked with developing a new application and running it. The team made the decision to take a microservices based approach to the application. Your team also has decided to utilize Docker containers and Azure as a cloud platform. Great, now it’s time to move forward right? Not so fast. There is no question that Docker containers will be used, but what is in question is where you will run the containers. In Azure containers can run on Azure’s managed Kubernetes (AKS) service, an App Service Plan on Azure App Service Environment (ASE), or Azure Service Fabric (ASF). Let’s look at each one of these Azure services including an overview, pro’s, cons, and pricing.
This Azure Kubernetes Service (AKS) Pros and Cons chart is clickable.This Azure App Service Environment (ASE) Pros and Cons chart is clickable.This Azure Service Fabric (ASF) Pros and Cons chart is clickable.
Conclusion:
Choose Azure Kubernetes Service if you need more control, want to avoid vendor lock-in (can run on Azure, AWS, GCP, on-prem), need features of a full orchestration system, flexibility of auto scale configurations, need deeper monitoring, flexibility with networking, public IP’s, DNS, SSL, need a rich ecosystem of addons, will have many multi-container deployments, and plan to run a large number of containers. Also, this is a low cost.
Choose Azure App Service Environment if don’t need as much control, want a dedicated SLA, don’t need deep monitoring or control of the underlying server infrastructure, want to leverage features such as deployment slots, green/blue deployments, will have simple and a low number of multi-container deployments via Docker compose, and plan to run a smaller number of containers. Regarding cost, running a containerized application in an App Service Plan in ASE tends to be more expensive compared to running in AKS or Service Fabric. The higher cost of running containers on ASE is because with an App Service Plan on ASE, you are paying costs for a combination of resources and the managed service. With AKS and ASF you are only paying for the resources used.
Choose Service Fabric if you want a full micros services platform, need flexibility now or in the future to run in cloud and or on-premises, will run native code in addition to containers, want automatic load balancing, low cost.
A huge thanks to my colleague Sunny Singh (@sunnys101) for giving his input and reviewing this post. Thanks for reading and check back for more Azure and container contents soon.
Part of running Kubernetes is being able to
monitoring the cluster, the nodes, and the workloads running in it. Running
production workloads regardless of PaaS, VM’s, or containers requires a solid
level of reliability. Azure Kubernetes Service comes with monitoring provided
from Azure bundled with the semi-managed service. Kubernetes also has built in
monitoring that can also be utilized.
It is important to note that AKS is a free
service and Microsoft aims to achieve at least 99.5% availability for the
Kubernetes API server on the master node side.
But due to AKS being a free service Microsoft
does not carry an SLA on the Kubernetes cluster service itself. Microsoft does
provide an SLA for the availability of the underlying nodes in the cluster via
the Azure Virtual Machines SLA. Without an official SLA for the Kubernetes
cluster service it becomes even more critical to understand your deployment and
have the right monitoring tooling and plan in place so when an issue arises the
DevOps or CloudOps team can address, investigate, and resolve any issues with the
cluster.
The monitoring service included with AKS
gives you monitoring from two perspectives including the first one being
directly from an AKS cluster and the second one being all AKS clusters in a
subscription. The monitoring looks at two key areas “Health status”
and “Performance charts” and consists of:
Insights – Monitoring for the
Kubernetes cluster and containers.
Metrics – Metric based
cluster and pod charts.
Log Analytics – K8s and Container
logs viewing and search.
Azure Monitor
Azure Monitor has a containers section. Here
is where you will find a health summary across all clusters in a subscription
including ACS. You also will see how many nodes and system/user pods a cluster
has and if there are any health issues with the a node or pod. If you click on
a cluster from here it will bring you to the Insights section on the AKS
cluster itself.
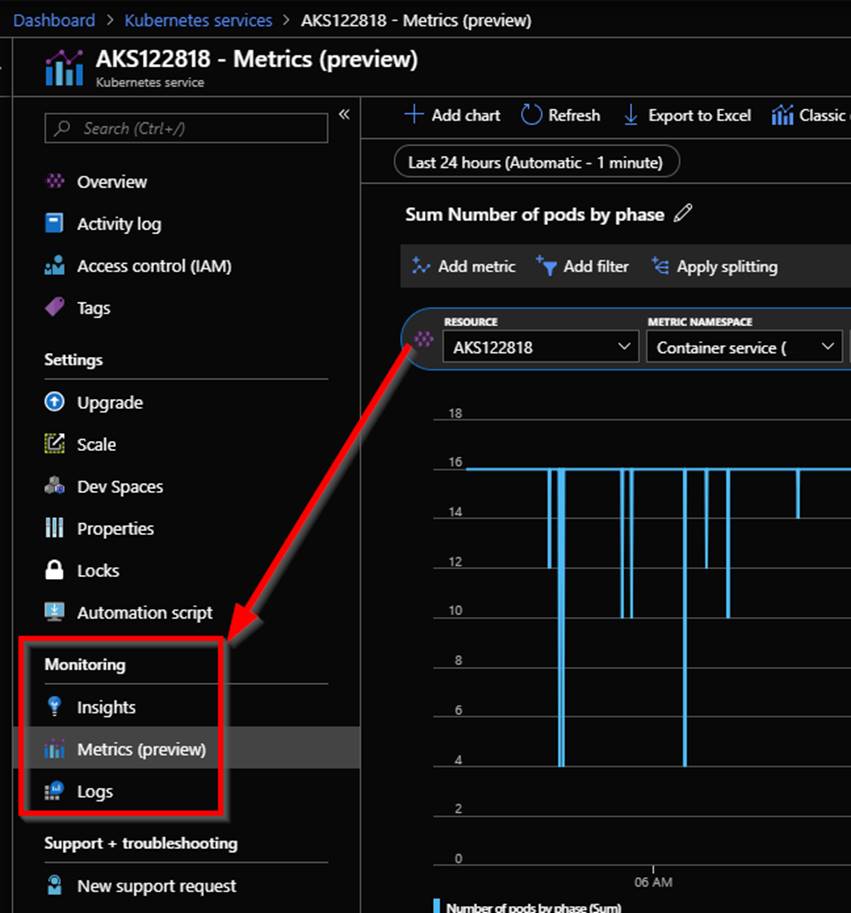
If you click on an AKS cluster you will be
brought to the Insights section of AKS monitoring on the actual AKS cluster.
From here you can access the Metrics section and the Logs section as well as
shown in the following screenshot.
Insights
Insights is where you will find the bulk of
useful data when it comes to monitoring AKS. Within Insights you have these 4
areas Cluster, Nodes, Controllers, and Containers. Let’s take a deeper look
into each of the 4 areas.
Cluster
The cluster page contains charts with key
performance metrics for your AKS clusters health. It has performance charts for
your node count with status, pod count with status, along with aggregated node
memory and CPU utilization across the cluster. In here you can change the date
range and add filters to scope down to specific information you want to see.
Nodes
After clicking on the nodes tab you will see
the nodes running in your AKS cluster along with uptime, amount of pods on the
node, CPU usage, memory working set, and memory RSS. You can click on the arrow
next to a node to expand it displaying the pods that are running on it.
What you will notice is that when you click
on a node, or pod a property pane will be shown on the right hand side with the
properties of the selected object. An example of a node is shown in the
following screenshot.
Controllers
Click on the Controllers tab to see the
health of the clusters controllers. Again here you will see CPU usage, memory
working set, and memory RSS of each controller and what is running a
controller. As an example shown in the following screenshot you can see the
kubernetes dashboard pod running on the kubernetes-dashboard controller.
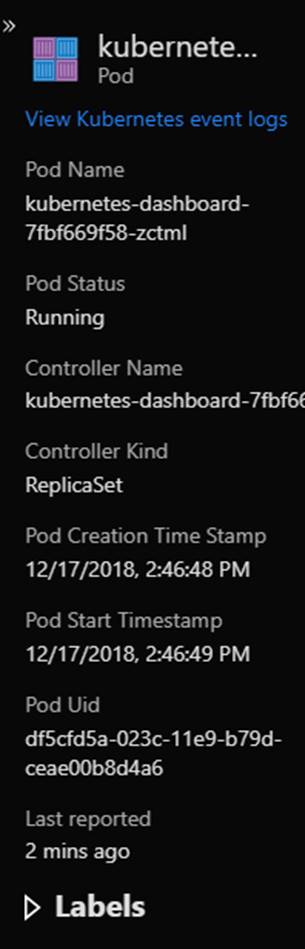
The properties of the kubernetes dashboard pod
as shown in the following screenshot gives you information like the pod name,
pod status, Uid, label and more.
You can drill in to see the container the pod
was deployed using.
Containers
On the Containers tab is where all the
containers in the AKS cluster are displayed. An as with the other tabs you can
see CPU usage, memory working set, and memory RSS. You also will see status,
the pod it is part of, the node its running on, its uptime and if it has had
any restarts. In the following screenshot the CPU usage metric filter is used
and I am showing a containers that has restarted 71 times indicating an issue
with that container.
In the
following screenshot the memory working set metric filter is shown.
You can also filter the
containers that will be shown through using the searching by name filter.
You also can see a containers logs in the containers tab. To do this select a container to show its properties. Within the properties you can click on View container live logs (preview) as shown in the following screenshot or View container logs. Container log data is collected every three minutes. STDOUT and STDERR is the log output from each Docker container that is sent to Log Analytics.
Kube-system is not currently collected and sent to Log Analytics. If you are not familiar with Docker logs more information on STDOUT and STDERR can be found on this Docker logging article here: https://docs.docker.com/config/containers/logging.
In this blog post I am going to walk through the steps for deploying WordPress to Azure Kubernetes Service (AKS) using MySQL and WordPress Docker images. Note that using the way I will show you is one way. Another way to deploy WordPress to AKS would be using a Helm Chart. Here is a link to the WordPress Helm Chart by Bitnami https://bitnami.com/stack/wordpress/helm. Here are the images we will use in this blog post:
The first thing we need to do is save these files as mysql-deployment.yaml and wordpress-deployment.yaml respectively.
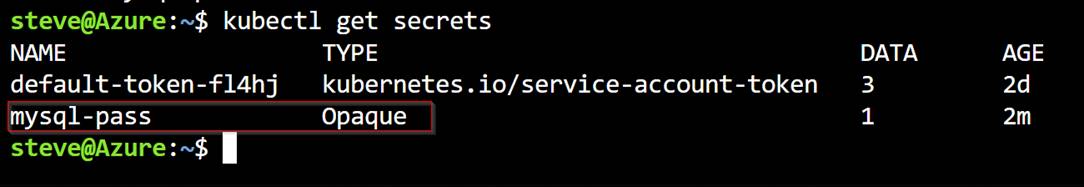
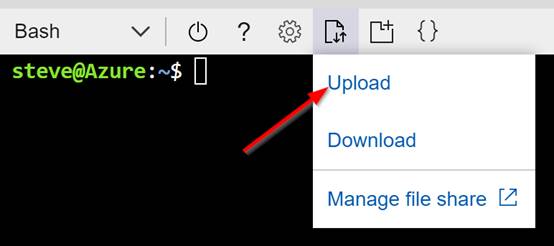
Next, we need to setup a password for our MySQL DB. We will do this by creating a secret on our K8s cluster. To do this launch the bash or PowerShell in Azure cloud shell like in the following screenshot and run the following syntax:
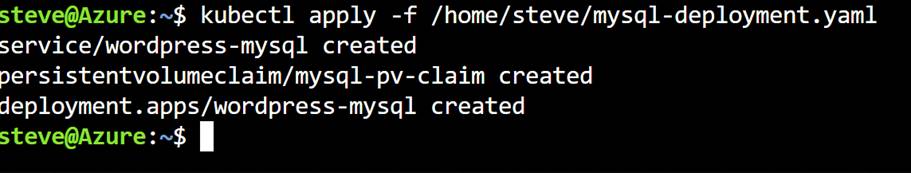
NOTE: You could use kubectl create /home/steve/mysql-deployment.yaml instead of apply to create the MySQL pod and service. I use apply because I typically use the declarative object configuration approach. kubectl apply essentially equals kubectl create + kubectl replace. In order to update an object after it has been created using kubectl create you would need to run kubectl replace.
There are pros and cons to using each and it is more of a preference for example when using the declarative approach there is no audit trail associated with changes. For more information on the multiple Kubernetes Object Management approaches go here: https://kubernetes.io/docs/concepts/overview/object-management-kubectl/overview.
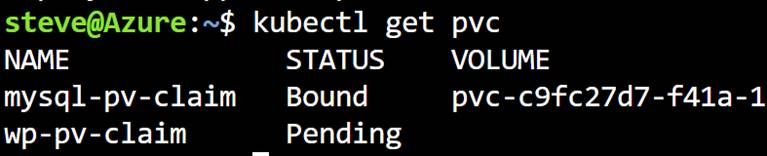
Note that in the mysql yaml file it has syntax to create a persistent volume. This is needed so that the database stays in tact even if the pod fails, is moved etc. You can check to ensure the persistent volume was created by running the following syntax:
kubectl get pvc
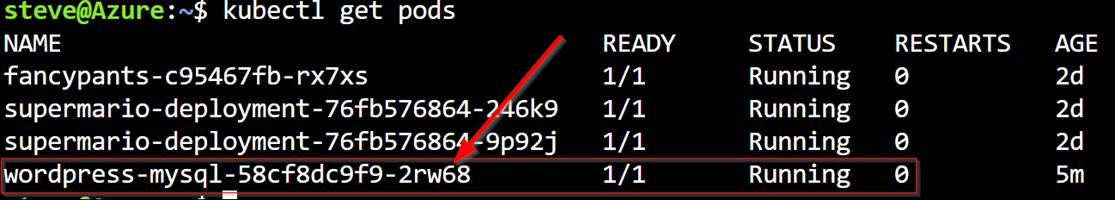
Also, you can run the following syntax to verify the mysql pod is running:
kubectl get pods
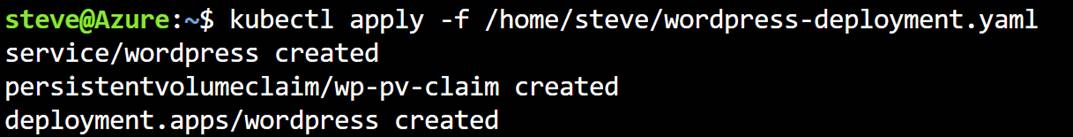
Deploying the WordPress Pod and service is the same process. Use the following syntax to create the WordPress pod and service:
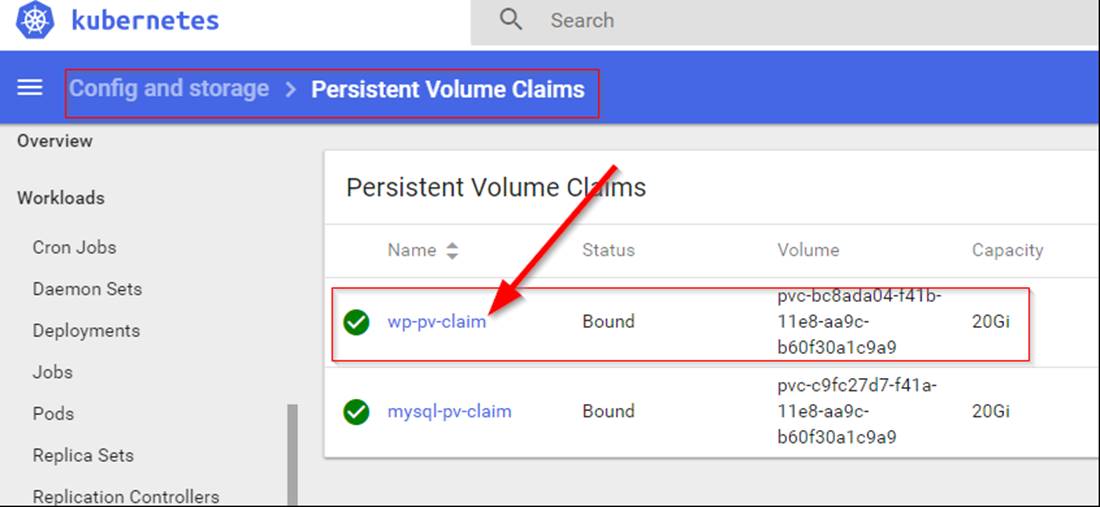
Again, check to ensure the persistent volume was created. Use the following syntax:
kubectl get pvc
NOTE: When checking right after you created the persistent volume it may be in a pending status for a while like shown in the following screenshot:
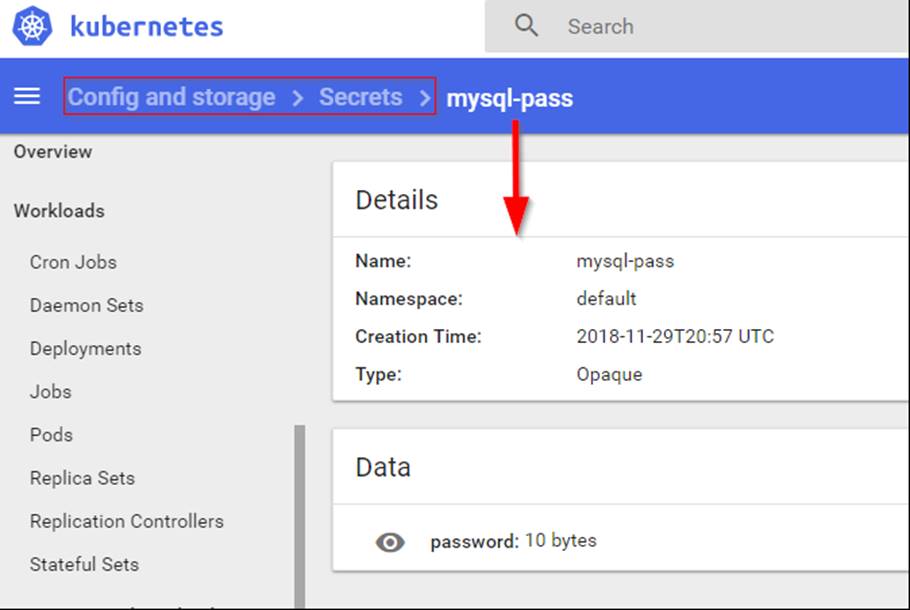
You can also check the persistent volume using the K8s dashboard as shown in the following screenshot:
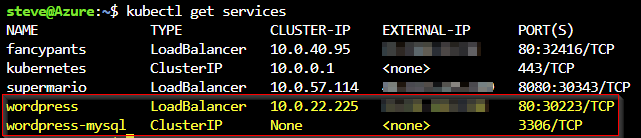
With the deployment of MySQL and WordPress we created 2 services. The MySQL service has a clusterip that can only be accessed internally. The WordPress service has an external IP that is also attached to an Azure Load Balancer for external access. I am not going to expand on what Kubernetes services are in this blog post but know that they are typically used as an abstracted layer in K8s used for access to Pods on the backend and follow the Pods regardless of the node they are running on. For more information about Kubernetes services visit this link: https://kubernetes.io/docs/concepts/services-networking/service.
In order to see that the services are running properly and find out the external IP you can run the following syntax:
kubectl get services (to see all services)
or
kubectl get services wordpress (to see just the WordPress service)
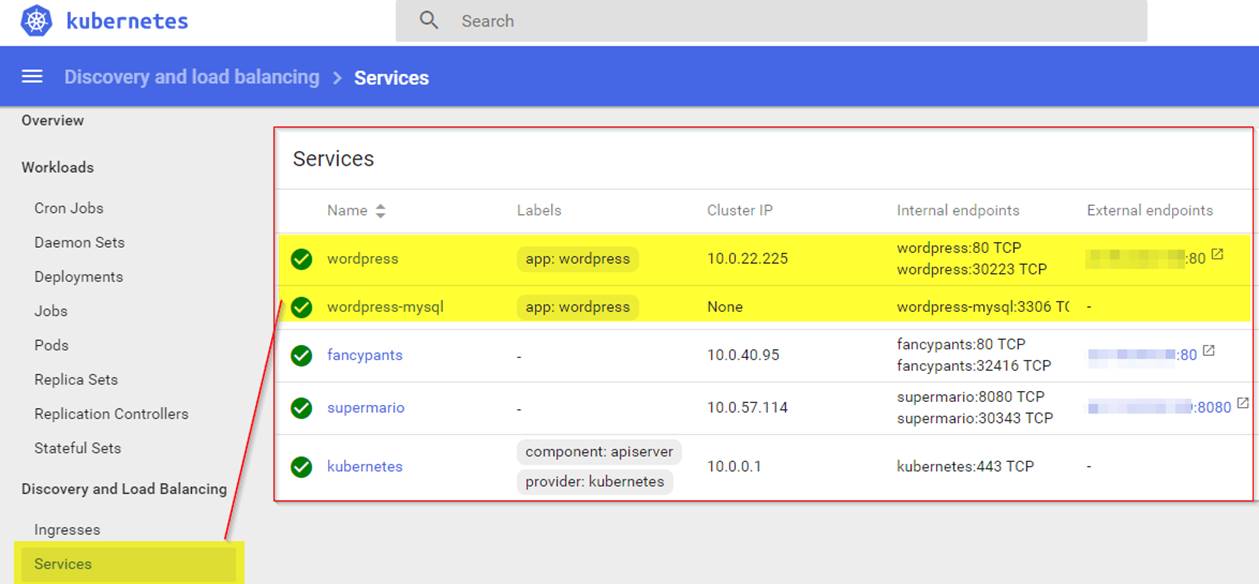
You also can view the services in the K8s dashboard as shown in the following screenshot:
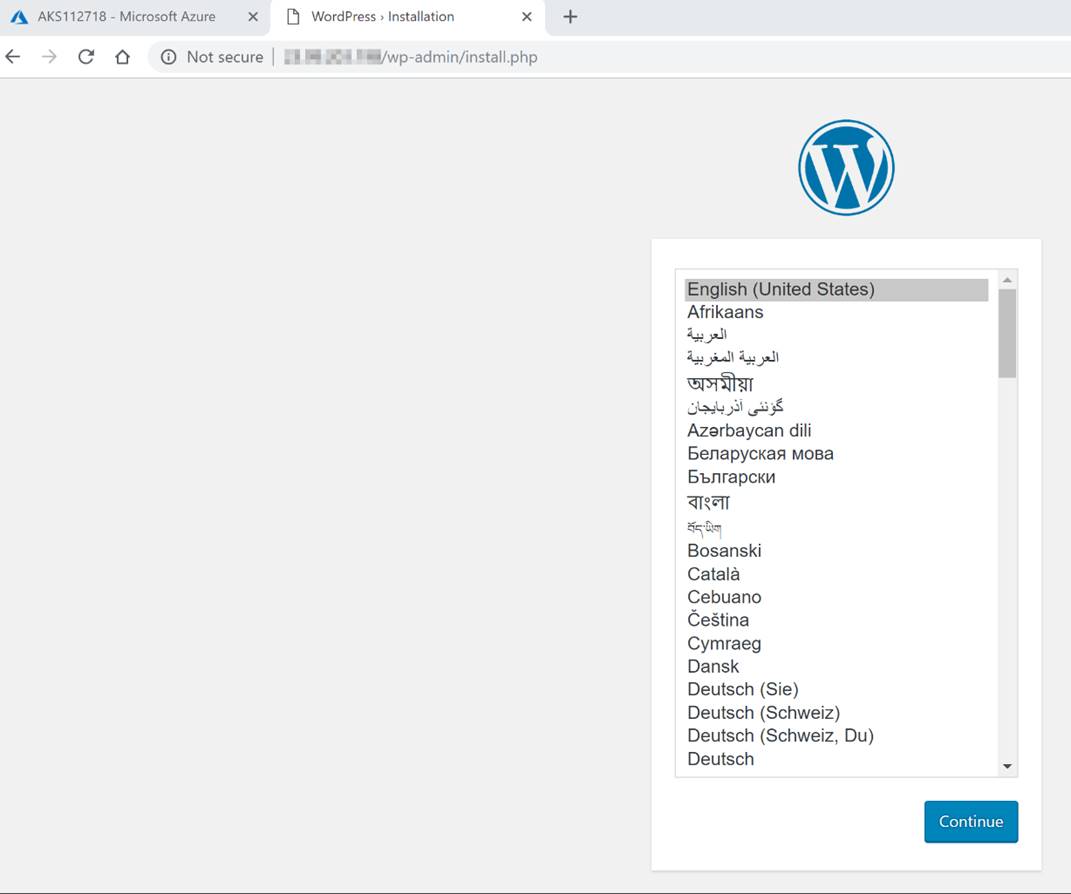
Well now that we have verified the pods and the services are running let’s check out our new WordPress instance by going to the external IP in a web browser.
Thanks for checking out this blog post. I hope this was an easy to use guide to get WordPress up and running on your Azure Kubernetes Service cluster. Check back soon for more Azure and Kubernetes/Container content.
In this blog post I am going to walk through the setup of an AKS cluster step by step. This is to serve as a intro to AKS to show how easy it is to get started with Kubernetes in Azure. In a follow up blog post I will dive into AKS more showing how … Read more