Deploy Rancher on Azure for Kubernetes Management

Lately I have been hearing a lot about a solution named Rancher in the Kubernetes space. Rancher is an open source Kubernetes Multi-Cluster Operations and Workload Management solution. You can learn more about Rancher here: https://www.rancher.com.

In short you can use Rancher to deploy and manage Kubernetes clusters deployed to Azure, AWS, GCP their managed Kubernetes offerings like GCE, EKS, AKS or even if you rolled your own. Rancher also integrates with a bunch of 3rd party solutions for things like authentication such as Active Directory, Azure Active Directory, Github, and Ping and logging solutions such as Splunk, Elasticsearch, or a Syslog endpoint.

Recently training opened up for some Rancher/Kubernetes/Docker training so I decided to go. The primary focus was on Rancher while also covering some good info on Docker and Kubernetes. This was really good training with a lot of hands on time, however there was one problem with the labs. The labs had instructions and setup scripts ready to go to run Rancher local on your laptop or on AWS via Terraform. There was nothing for Azure.

I ended up getting my Rancher environment running on Azure but it would have been nice to have some scripts or templates ready to go to spin up Rancher on Azure. I did find some ARM templates to spin up Rancher but they deployed an old version and it was not clear in the templates on where they could be updated to deploy the new version of Rancher. I decided to spend some time building out a couple of ARM templates that can be used to quickly deploy Rancher on Azure and add a Kubernetes host to Rancher. In the ARM template I pulled together it pulls the Rancher container from Docker Hub so it will always deploy the latest version. In this blog post I will spell out the steps to get your Rancher up and running in under 15 minutes.

First off you can find the ARM Templates here on my Github here: https://github.com/Buchatech/DeployRanchertoAzure.

The repository consists of ARM templates for deploying Rancher and a host VM for Kubernetes. NOTE: These templates are intended for labs to learn Rancher. They are not intended for use in production.

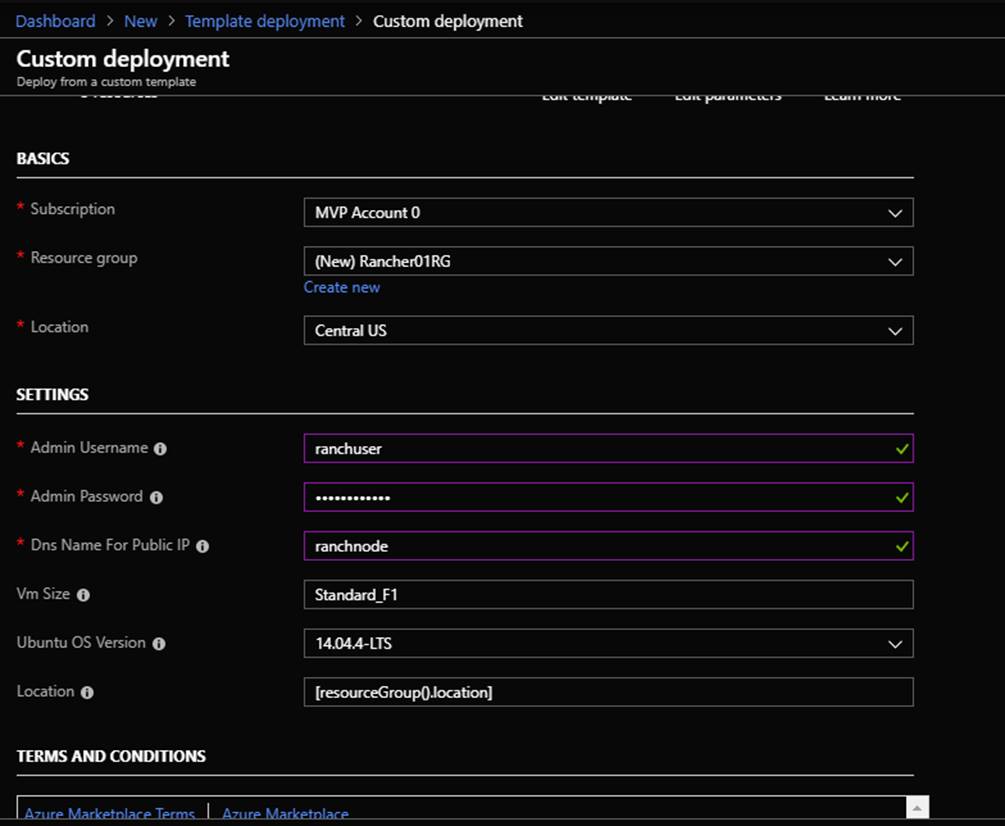
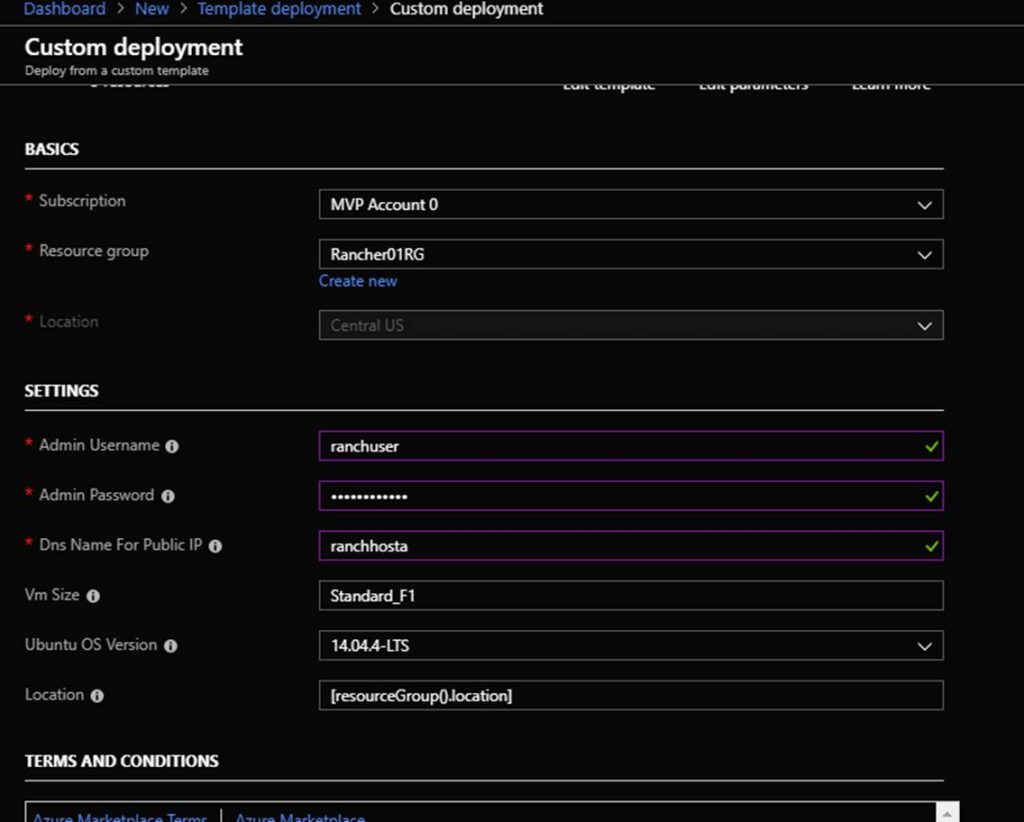
In the repo ARM Template #1 named RancherNode.JSON will deploy an Ubuntu VM with Docker and the latest version of Rancher (https://hub.docker.com/r/rancher/rancher) from Docker Hub. ARM Template #2 named RancherHost.JSON will deploy an Ubuntu VM with Docker to be used as a Kubernetes host in Rancher.

Node Deployment

Deploy the RancherNode.JSON ARM template to your Azure subscription through “Template Deployment” or other deployment method. You will be prompted for the following info shown in the screenshot:

Host Deployment

Deploy the RancherHost.JSON ARM template to your Azure subscription through “Template Deployment” or other deployment method. Note that that should deploy this into the same Resource Group that you deployed the Rancher Node ARM template into. You will be prompted for the following info shown in the screenshot:

After the Rancher Node and Rancher Host ARM templates are deployed you should see the following resources in the new Resource Group:

NameType
RancherVNet Virtual network
RancherHost Virtual machine
RancherNode Virtual machine
RancherHostPublicIP Public IP address
RancherNodePublicIP Public IP address
RancherHostNic Network interface
RancherNodeNic Network interface
RancherHost_OSDisk Disk
RancherNode_OSDisk Disk

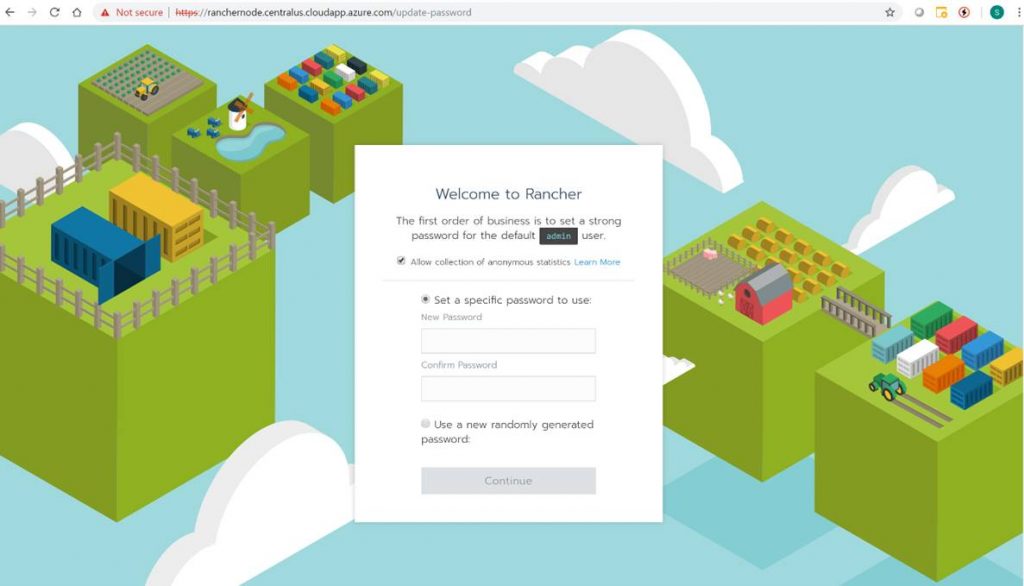
Next navigate the Rancher portal in the web browser. The URL is the DNS name of the Rancher Node VM. You can find the DNS name by clicking on the Rancher Node VM in the Azure portal on the overview page. Here is an example of the URL:

https://ranchernode.centralus.cloudapp.azure.com

The Rancher portal will prompt you to set a password. This is shown in the following screenshot.

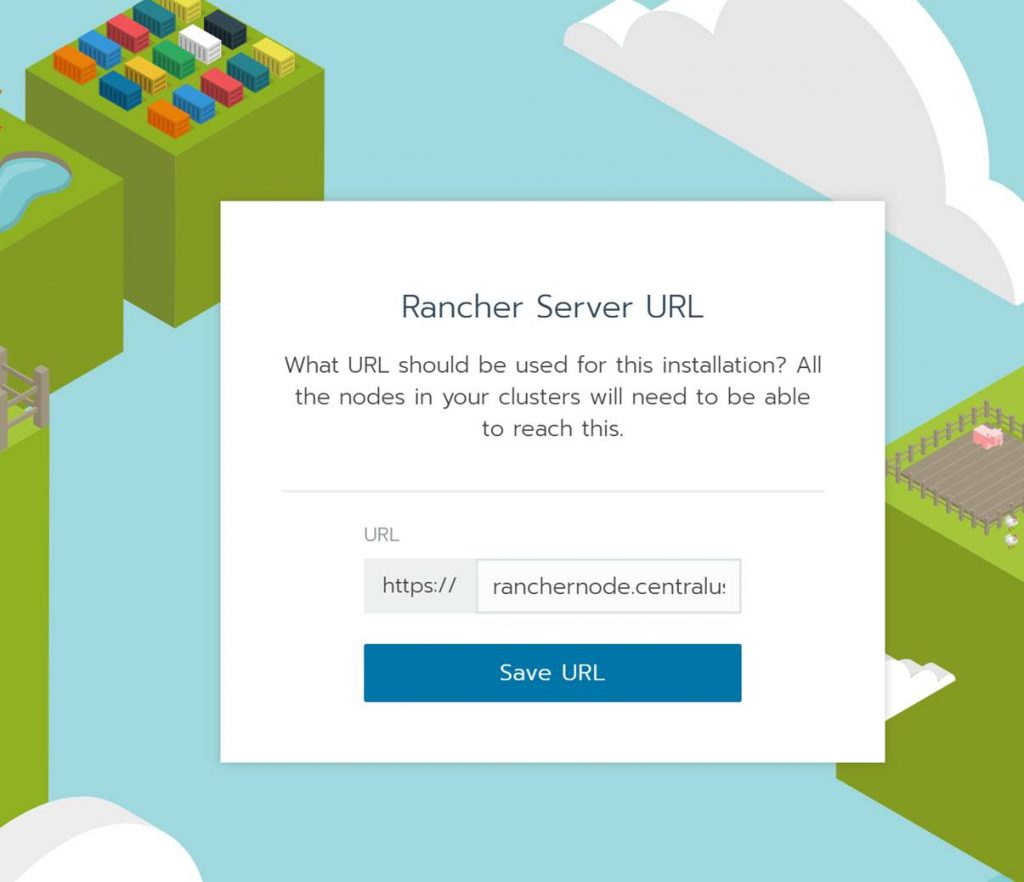
After setting the password the Rancher portal will prompt you for the correct Rancher Server URL. This will automatically be the Rancher Node VM DNS name. Click Save URL.

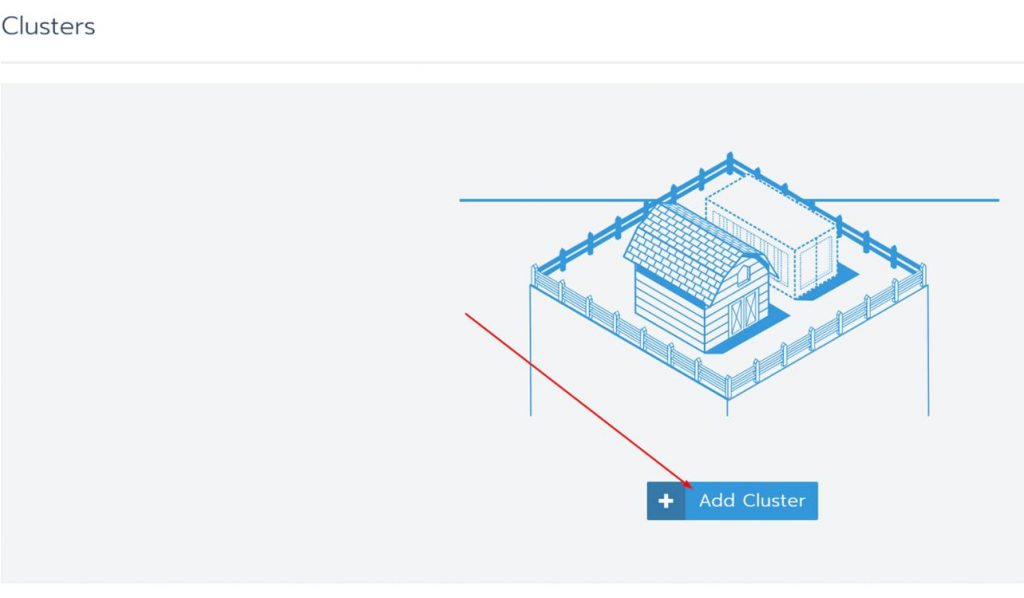
You will then be logged into the Rancher portal. You will see the cluster page. From here you will want to add a cluster. Doing this is how you add a new Kubernetes cluster to Rancher. In this post I will show you how to add a cluster to the Rancher Host VM. When it’s all said and done Rancher will have successfully deployed Kubernetes to the Rancher Host VM. Note that you could add a managed Kubernetes such as AKS but we won’t do that in this blog. I will save that for a future blog post!

Click on Add Cluster

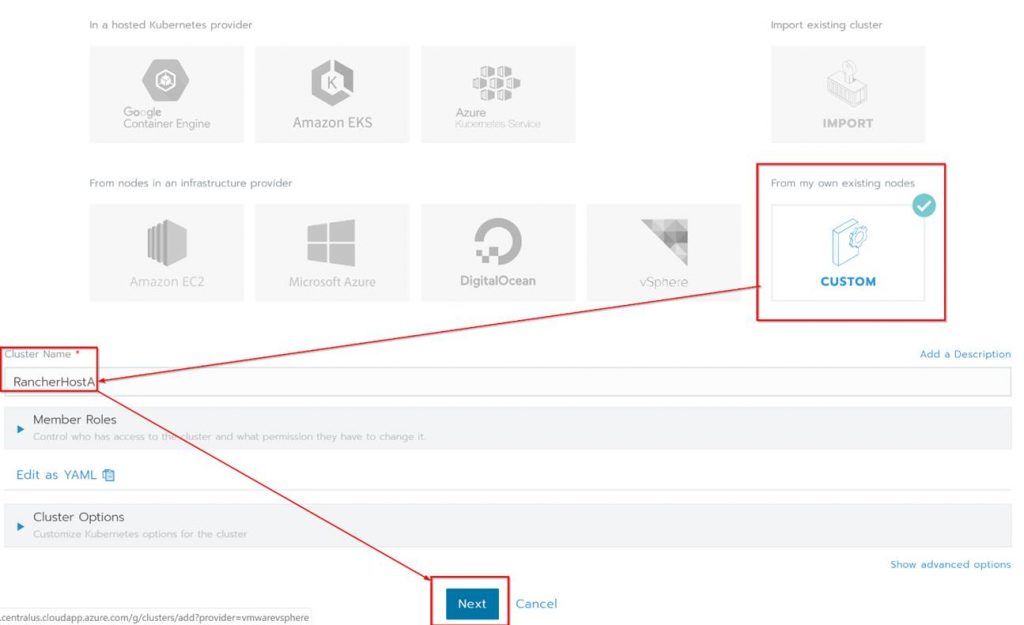
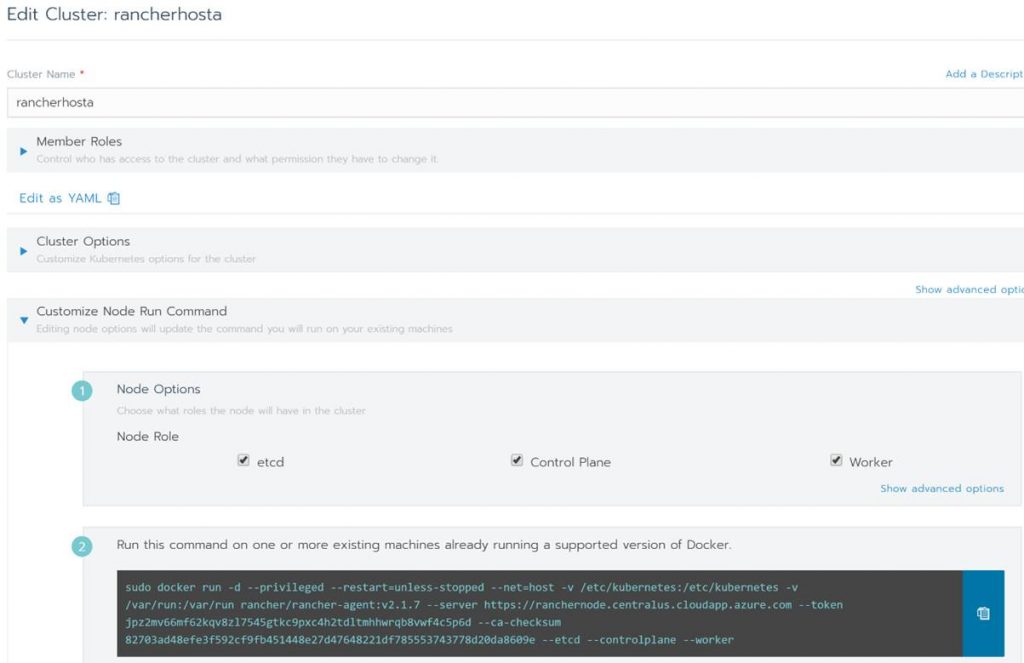
Under “From my own existing nodes” Click on custom, give the cluster a name and click Next.

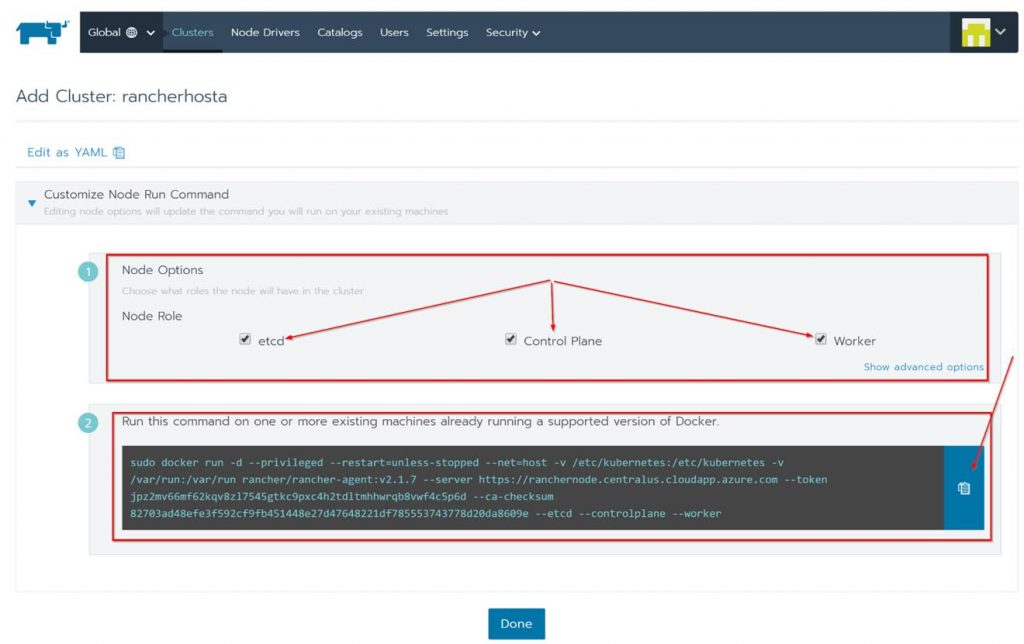
Next check all the boxes for the Node Options since all the roles will be on a single Kubernetes cluster. Copy the code shown at the bottom of the page, click done and run the code on the Rancher Host.

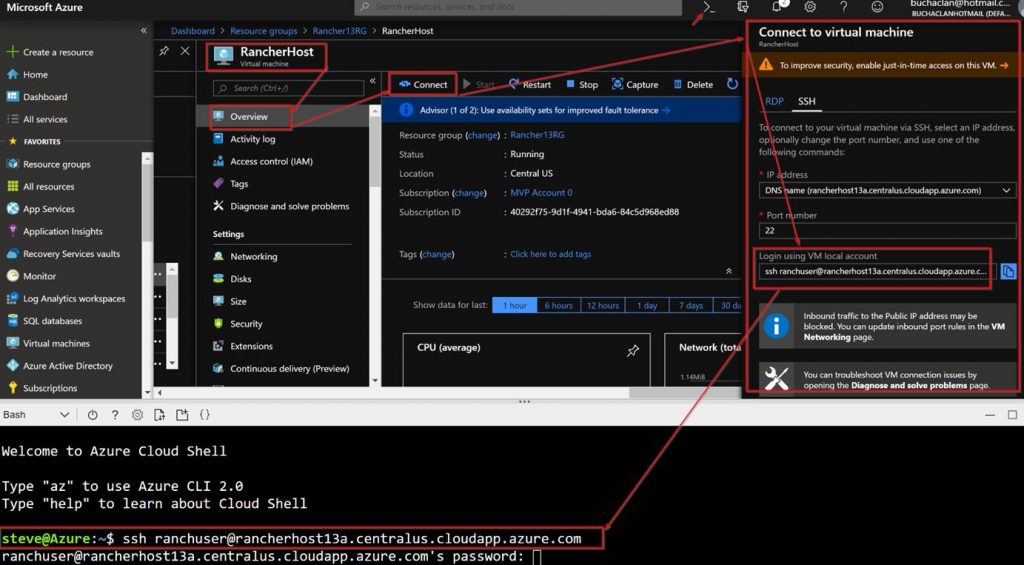
In order to run the code on the Rancher Host you need to SSH in and run it from there. To do this follow these steps:

  1. In the Azure Portal, from within the resource group click on the Rancher Host VM.
  2. On the Overview page click on Connect.
  3. Copy “ssh ranchuser@rancherhost.centralus.cloudapp.azure.com” from the Connect to virtual machine pop up screen.
  4. Open a terminal in either Azure cloud shell or with something like a terminal via VS Code and past the “ssh ranchuser@rancherhost.centralus.cloudapp.azure.com” in.

Running the code will look like this:

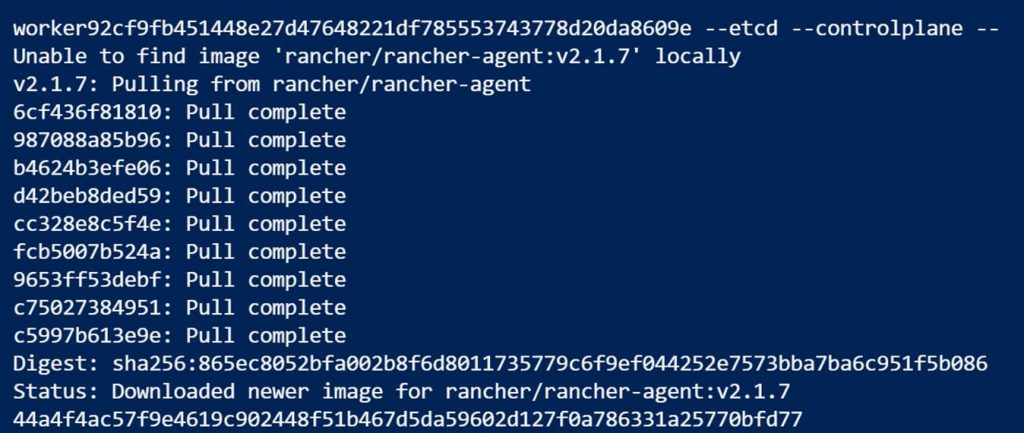
When done you can run Docker PS to see that the Rancher agent containers are running.

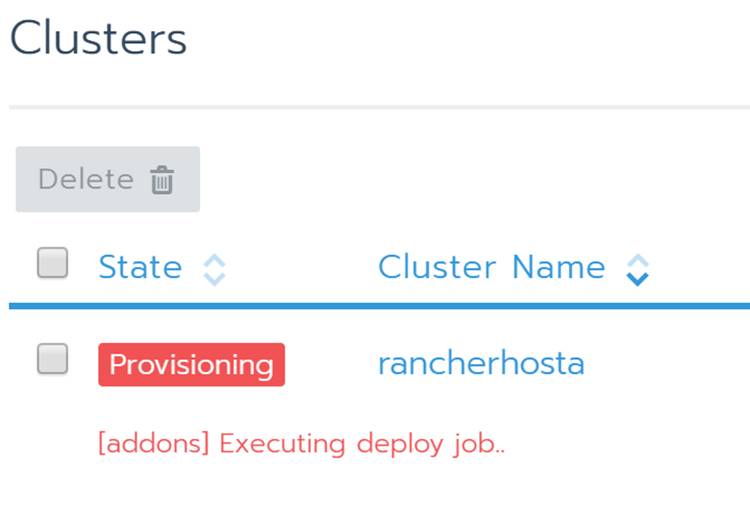
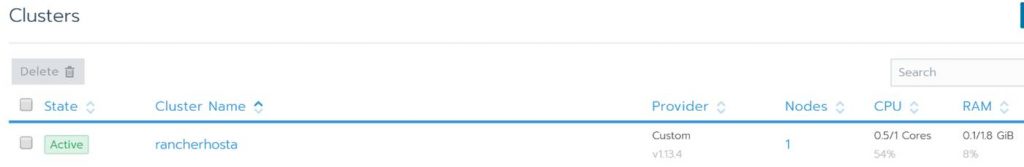
In the Rancher portal under clusters you will see the Rancher host being provisioned

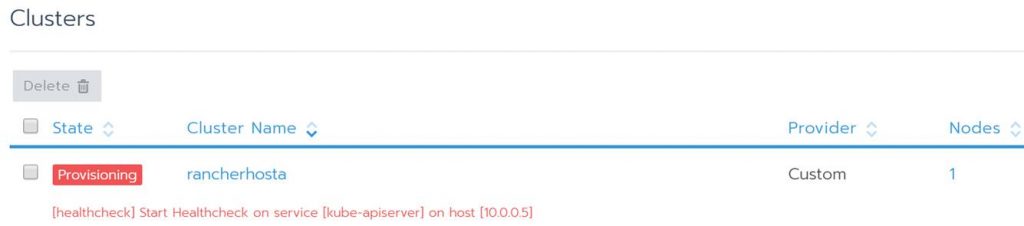
The status will change as Kubernetes is deployed.

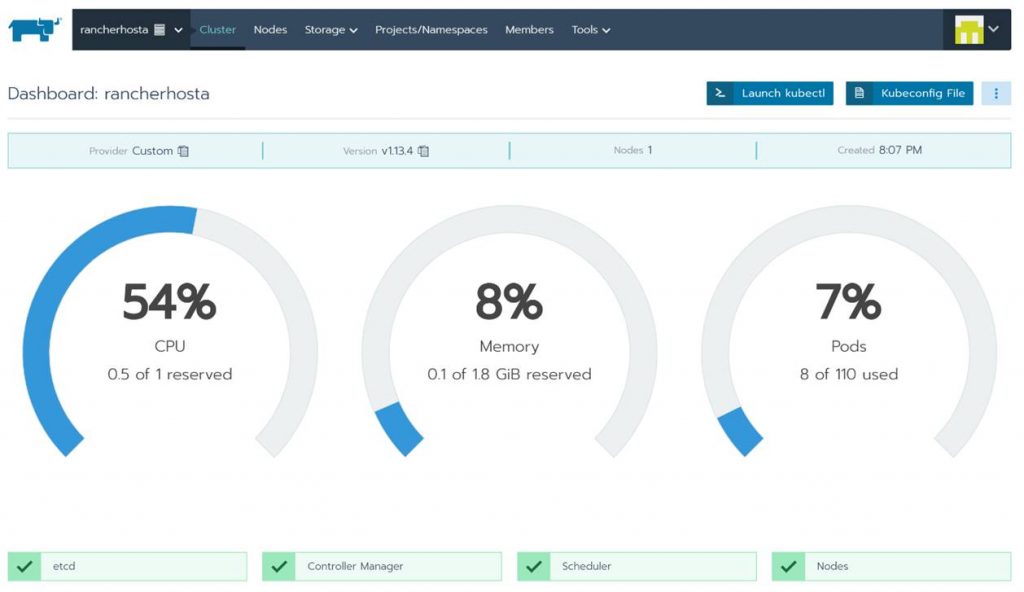
Once it’s done provisioning you will see your Kubernetes cluster as Active.

From here you can see a bunch of info about your new Kubernetes cluster. Also notice that you could even launch Kubectl right from hereand start running commands! Take some time to click around to see all the familiar stuff you are used to working with in Kubernetes. This is pretty cool and simplifies the management experience for Kubernetes. 

If you want to add more nodes or need the configuration code again just click the ellipsis button and edit.

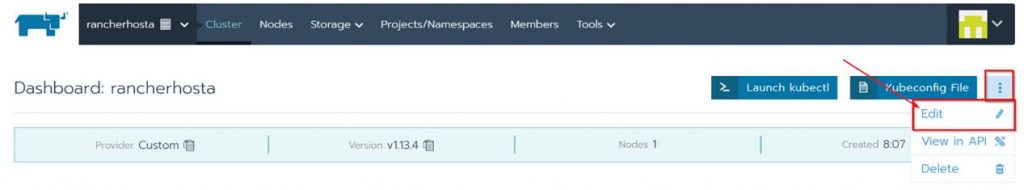
In Edit Cluster you can change the cluster name, get and change settings and copy the code to add more VMs to the cluster.

That’s the end of this post. Thanks for reading. Check back for more Azure, Kubernetes, and Rancher blog posts.

Read more

Where to host Docker Containers on Azure (AKS, ASE, or ASF)?

Azure Kubernetes Service (AKS) service Azure App Service Environment (ASE) Azure Service Fabric (ASF) Comparison

Scenario:

So, your team recently has been tasked with developing a new application and running it. The team made the decision to take a microservices based approach to the application. Your team also has decided to utilize Docker containers and Azure as a cloud platform. Great, now it’s time to move forward right? Not so fast. There is no question that Docker containers will be used, but what is in question is where you will run the containers. In Azure containers can run on Azure’s managed Kubernetes (AKS) service, an App Service Plan on Azure App Service Environment (ASE), or Azure Service Fabric (ASF). Let’s look at each one of these Azure services including an overview, pro’s, cons, and pricing.

This Azure Kubernetes Service (AKS) Pros and Cons chart is clickable.
This Azure App Service Environment (ASE) Pros and Cons chart is clickable.
This Azure Service Fabric (ASF) Pros and Cons chart is clickable.

Conclusion:

Choose Azure Kubernetes Service if you need more control, want to avoid vendor lock-in (can run on Azure, AWS, GCP, on-prem), need features of a full orchestration system, flexibility of auto scale configurations, need deeper monitoring, flexibility with networking, public IP’s, DNS, SSL, need a rich ecosystem of addons, will have many multi-container deployments, and plan to run a large number of containers. Also, this is a low cost.

Choose Azure App Service Environment if don’t need as much control, want a dedicated SLA, don’t need deep monitoring or control of the underlying server infrastructure, want to leverage features such as deployment slots, green/blue deployments, will have simple and a low number of multi-container deployments via Docker compose, and plan to run a smaller number of containers. Regarding cost, running a containerized application in an App Service Plan in ASE tends to be more expensive compared to running in AKS or Service Fabric. The higher cost of running containers on ASE is because with an App Service Plan on ASE, you are paying costs for a combination of resources and the managed service. With AKS and ASF you are only paying for the resources used.

Choose Service Fabric if you want a full micros services platform, need flexibility now or in the future to run in cloud and or on-premises, will run native code in addition to containers, want automatic load balancing, low cost.

A huge thanks to my colleague Sunny Singh (@sunnys101) for giving his input and reviewing this post. Thanks for reading and check back for more Azure and container contents soon.

Read more

Monitoring Azure Kubernetes Service (AKS) with Azure Monitor & Log Analytics

Part of running Kubernetes is being able to monitoring the cluster, the nodes, and the workloads running in it. Running production workloads regardless of PaaS, VM’s, or containers requires a solid level of reliability. Azure Kubernetes Service comes with monitoring provided from Azure bundled with the semi-managed service. Kubernetes also has built in monitoring that can also be utilized.

It is important to note that AKS is a free service and Microsoft aims to achieve at least 99.5% availability for the Kubernetes API server on the master node side.

But due to AKS being a free service Microsoft does not carry an SLA on the Kubernetes cluster service itself. Microsoft does provide an SLA for the availability of the underlying nodes in the cluster via the Azure Virtual Machines SLA. Without an official SLA for the Kubernetes cluster service it becomes even more critical to understand your deployment and have the right monitoring tooling and plan in place so when an issue arises the DevOps or CloudOps team can address, investigate, and resolve any issues with the cluster.

The monitoring service included with AKS gives you monitoring from two perspectives including the first one being directly from an AKS cluster and the second one being all AKS clusters in a subscription. The monitoring looks at two key areas “Health status” and “Performance charts” and consists of:

Insights – Monitoring for the Kubernetes cluster and containers.

Metrics – Metric based cluster and pod charts.

Log Analytics – K8s and Container logs viewing and search.

Azure Monitor

Azure Monitor has a containers section. Here is where you will find a health summary across all clusters in a subscription including ACS. You also will see how many nodes and system/user pods a cluster has and if there are any health issues with the a node or pod. If you click on a cluster from here it will bring you to the Insights section on the AKS cluster itself.

If you click on an AKS cluster you will be brought to the Insights section of AKS monitoring on the actual AKS cluster. From here you can access the Metrics section and the Logs section as well as shown in the following screenshot.

Insights

Insights is where you will find the bulk of useful data when it comes to monitoring AKS. Within Insights you have these 4 areas Cluster, Nodes, Controllers, and Containers. Let’s take a deeper look into each of the 4 areas.

Cluster

The cluster page contains charts with key performance metrics for your AKS clusters health. It has performance charts for your node count with status, pod count with status, along with aggregated node memory and CPU utilization across the cluster. In here you can change the date range and add filters to scope down to specific information you want to see.

Nodes

After clicking on the nodes tab you will see the nodes running in your AKS cluster along with uptime, amount of pods on the node, CPU usage, memory working set, and memory RSS. You can click on the arrow next to a node to expand it displaying the pods that are running on it.

What you will notice is that when you click on a node, or pod a property pane will be shown on the right hand side with the properties of the selected object. An example of a node is shown in the following screenshot.

Controllers

Click on the Controllers tab to see the health of the clusters controllers. Again here you will see CPU usage, memory working set, and memory RSS of each controller and what is running a controller. As an example shown in the following screenshot you can see the kubernetes dashboard pod running on the kubernetes-dashboard controller.

The properties of the kubernetes dashboard pod as shown in the following screenshot gives you information like the pod name, pod status, Uid, label and more.

You can drill in to see the container the pod was deployed using.

Containers

On the Containers tab is where all the containers in the AKS cluster are displayed. An as with the other tabs you can see CPU usage, memory working set, and memory RSS. You also will see status, the pod it is part of, the node its running on, its uptime and if it has had any restarts. In the following screenshot the CPU usage metric filter is used and I am showing a containers that has restarted 71 times indicating an issue with that container.

 In the following screenshot the memory working set metric filter is shown.

You can also filter the containers that will be shown through using the searching by name filter.

You also can see a containers logs in the containers tab. To do this select a container to show its properties. Within the properties you can click on View container live logs (preview) as shown in the following screenshot or View container logs. Container log data is collected every three minutes. STDOUT and STDERR is the log output from each Docker container that is sent to Log Analytics.

Kube-system is not currently collected and sent to Log Analytics. If you are not familiar with Docker logs more information on STDOUT and STDERR can be found on this Docker logging article here:  https://docs.docker.com/config/containers/logging.

Read more

Deploy MySQL and WordPress on Azure Kubernetes Service (AKS)

In this blog post I am going to walk through the steps for deploying WordPress to Azure Kubernetes Service (AKS) using MySQL and WordPress Docker images. Note that using the way I will show you is one way. Another way to deploy WordPress to AKS would be using a Helm Chart. Here is a link to the WordPress Helm Chart by Bitnami https://bitnami.com/stack/wordpress/helm. Here are the images we will use in this blog post:

MySQL WordPress
apiVersion: v1
kind: Service
metadata:
name: wordpress-mysql
labels:
app: wordpress
spec:
ports:
– port: 3306
selector:
app: wordpress
tier: mysql
clusterIP: None

apiVersion: v1
kind: PersistentVolumeClaim
metadata:
name: mysql-pv-claim
labels:
app: wordpress
spec:
accessModes:
– ReadWriteOnce
resources:
requests:
storage: 20Gi

apiVersion: apps/v1 # for versions before 1.9.0 use apps/v1beta2
kind: Deployment
metadata:
name: wordpress-mysql
labels:
app: wordpress
spec:
selector:
matchLabels:
app: wordpress
tier: mysql
strategy:
type: Recreate
template:
metadata:
labels:
app: wordpress
tier: mysql
spec:
containers:
– image: mysql:5.6
name: mysql
env:
– name: MYSQL_ROOT_PASSWORD
valueFrom:
secretKeyRef:
name: mysql-pass
key: password
ports:
– containerPort: 3306
name: mysql
volumeMounts:
– name: mysql-persistent-storage
mountPath: /var/lib/mysql
volumes:
– name: mysql-persistent-storage
persistentVolumeClaim:
claimName: mysql-pv-claim
apiVersion: v1
kind: Service
metadata:
name: wordpress
labels:
app: wordpress
spec:
ports:
– port: 80
selector:
app: wordpress
tier: frontend
type: LoadBalancer

apiVersion: v1
kind: PersistentVolumeClaim
metadata:
name: wp-pv-claim
labels:
app: wordpress
spec:
accessModes:
– ReadWriteOnce
resources:
requests:
storage: 20Gi

apiVersion: apps/v1 # for versions before 1.9.0 use apps/v1beta2
kind: Deployment
metadata:
name: wordpress
labels:
app: wordpress
spec:
selector:
matchLabels:
app: wordpress
tier: frontend
strategy:
type: Recreate
template:
metadata:
labels:
app: wordpress
tier: frontend
spec:
containers:
– image: wordpress:4.8-apache
name: wordpress
env:
– name: WORDPRESS_DB_HOST
value: wordpress-mysql
– name: WORDPRESS_DB_PASSWORD
valueFrom:
secretKeyRef:
name: mysql-pass
key: password
ports:
– containerPort: 80
name: wordpress
volumeMounts:
– name: wordpress-persistent-storage
mountPath: /var/www/html
volumes:
– name: wordpress-persistent-storage
persistentVolumeClaim:
claimName: wp-pv-claim

The first thing we need to do is save these files as mysql-deployment.yaml and wordpress-deployment.yaml respectively.

Next, we need to setup a password for our MySQL DB. We will do this by creating a secret on our K8s cluster. To do this launch the bash or PowerShell in Azure cloud shell like in the following screenshot and run the following syntax:

kubectl create secret generic mysql-pass –from-literal=password=”YOURPASSWORDHERE”

Note: Replace “PASSWORDHERE” in the syntax with your own password.

The secret is now created. To ensure it was created you can run the following syntax to list the secrets:

kubectl get secrets

You also can see the secret in the Kubernetes dashboard as shown in the following screenshot.

Next the mysql-deployment.yaml and wordpress-deployment.yaml files from the beginning of this post need to be uploaded to Azure cloudrive storage.

You can also do this in the Cloudshell as shown in the following screenshot.

Run ls in the shell to make sure the files are on your clouddrive.

You will need your home drive. Mine was. /home/steve. To see this, click on Download. It will show you what yours is.

Next create the MySQL Pod and service by running the following syntax.

kubectl apply -f /home/steve/mysql-deployment.yaml

NOTE: You could use kubectl create /home/steve/mysql-deployment.yaml instead of apply to create the MySQL pod and service. I use apply because I typically use the declarative object configuration approach. kubectl apply essentially equals kubectl create + kubectl replace. In order to update an object after it has been created using kubectl create you would need to run kubectl replace.

There are pros and cons to using each and it is more of a preference for example when using the declarative approach there is no audit trail associated with changes. For more information on the multiple Kubernetes Object Management approaches go here: https://kubernetes.io/docs/concepts/overview/object-management-kubectl/overview.

Note that in the mysql yaml file it has syntax to create a persistent volume. This is needed so that the database stays in tact even if the pod fails, is moved etc. You can check to ensure the persistent volume was created by running the following syntax:

kubectl get pvc

Also, you can run the following syntax to verify the mysql pod is running:

kubectl get pods

Deploying the WordPress Pod and service is the same process. Use the following syntax to create the WordPress pod and service:

kubectl apply -f /home/steve/wordpress-deployment.yaml

Again, check to ensure the persistent volume was created. Use the following syntax:

kubectl get pvc

NOTE: When checking right after you created the persistent volume it may be in a pending status for a while like shown in the following screenshot:

You can also check the persistent volume using the K8s dashboard as shown in the following screenshot:

With the deployment of MySQL and WordPress we created 2 services. The MySQL service has a clusterip that can only be accessed internally. The WordPress service has an external IP that is also attached to an Azure Load Balancer for external access. I am not going to expand on what Kubernetes services are in this blog post but know that they are typically used as an abstracted layer in K8s used for access to Pods on the backend and follow the Pods regardless of the node they are running on. For more information about Kubernetes services visit this link: https://kubernetes.io/docs/concepts/services-networking/service.

In order to see that the services are running properly and find out the external IP you can run the following syntax:

kubectl get services (to see all services)

or

kubectl get services wordpress (to see just the WordPress service)

You also can view the services in the K8s dashboard as shown in the following screenshot:

Well now that we have verified the pods and the services are running let’s check out our new WordPress instance by going to the external IP in a web browser.

Thanks for checking out this blog post. I hope this was an easy to use guide to get WordPress up and running on your Azure Kubernetes Service cluster. Check back soon for more Azure and Kubernetes/Container content.

Read more

Microsoft Professional Program for DevOps Finished!

I am a firm believer that no matter how old you are, how far along you are in your career, and regardless of the industry you are in it is important to continue educating yourself. This helps you expand your skillset, stay relevant, and sets you up for new opportunities as they come along. My field of information technology has been changing at a rapid pace and so for a while, I wanted a good way to ramp up on DevOps as a whole. A while back I found out that Microsoft added a new track to their Professional Program for DevOps. When I checked it out I found it to be very thorough and it was not just focused on Microsoft’s DevOps tooling but included non-Microsoft as well. I jumped in without hesitation and started learning.

I finally completed the program last week. Here is my certificate https://academy.microsoft.com/en-us/certificates/67284e84-8afe-4f13-b477-d7620949fb18. I am planning to dive into the program they have for cloud next. If you have not heard of Microsoft’s Professional Program DevOps before here more information about it:

“DevOps is the union of people, process, and products to enable continuous delivery of value to end users. This program helps the student learn about continuous integration and deployment, infrastructure as code, testing, databases, containers, and application monitoring: skills necessary for a DevOps culture in today’s workplace. This program focuses on Microsoft DevOps technologies as well as some OSS (Open Source Software) DevOps tools. Some of the Microsoft DevOps technologies covered in this course consist of Azure, Azure Resource Manager, IaaS, PaaS, IIS, Azure App Service, DevTest labs, Desired State Configuration (DSC), Azure Automation, OMS, Application Insights, SQL, Nuget, TFS, VSTS, and Visual Studio. Some of the OSS DevOps tools covered in this course consist of Jenkins, Git, Github, New Relic, Nagios, Chef, Docker, DC/OS, swarm, and Kubernetes.”

Here is a link to it:  https://academy.microsoft.com/en-us/tracks/devops

This program consists of 8 required courses. Each course runs for three months and starts at the beginning of a quarter. In the end, there is a capstone that has to be completed. This capstone course is the 8th one. You have four weeks to complete the capstone. The capstone is a bunch of hands-on stuff you have to do. Courses average 16-32 hours per course to complete and are taken via the edX.org platform https://www.edx.org/microsoft-professional-program-devops.

Here is a list of all of the DevOps program courses:

      • Introduction to Dev Ops Practices
      • Infrastructure as Code
      • Continuous Integration and Continuous Deployment
      • Configuration Management for Containerized Delivery
      • DevOps Testing
      • DevOps for Databases
      • Application Monitoring and Feedback Loops
      • Microsoft Professional DevOps Capstone Project
      • The DevOps Capstone Project contains:
        • Automation
          • Use ARM templates to deploy and configure Infrastructure in Azure
        • Continuous Integration
          • Implement Continuous Integration solution using Visual Studio Team services (VSTS)
        • Continuous deployment
          • Implement Continuous Deployment solution using Visual Studio Team Services (VSTS)
        • Testing
          • Implement Unit tests
          • Implement Testing in Production
        • Application Monitoring
          • Implement application monitoring solution using Application Insights

As you can see from that list this program is not just all about VSTS. There is a lot of Azure baked in as well as other non-Microsoft DevOps tooling. I highly recommend this course for anyone jumping into DevOps, or CloudOps and especially for folks with an IT pro background. If CloudOps is foreign to you here are a couple of blogs related to this topic: Sys Admin to Cloud Admin…ITSM to CloudOps…On-Prem to Azure Stack/Azure and Native Cloud Management in Azure.

My personal opinion is that Microsoft should move away from the certifications as they are and to this format. This format combines training and testing. When Microsoft first started the Professional Program for they only had a track for data scientists. They have added more and more tracks over time. Today there are tracks also for Big Data, Web Development, Software Development, AI, IT Support, and Cloud Administration.

Here is a link for all the tracks so you can check them out: https://academy.microsoft.com/en-us/professional-program/tracks. These programs are a great way to expand your learning. Check them out!

Read more